Economic Data Trends by City
Authors: Stephen Uong & Jenny Dusendang
Abstract: The Economic Data Trends By City application allows users to explore a variety of economic statistics by United States city. These metrics can be visualized over time, in reference to other metrics, and/or by mapping.
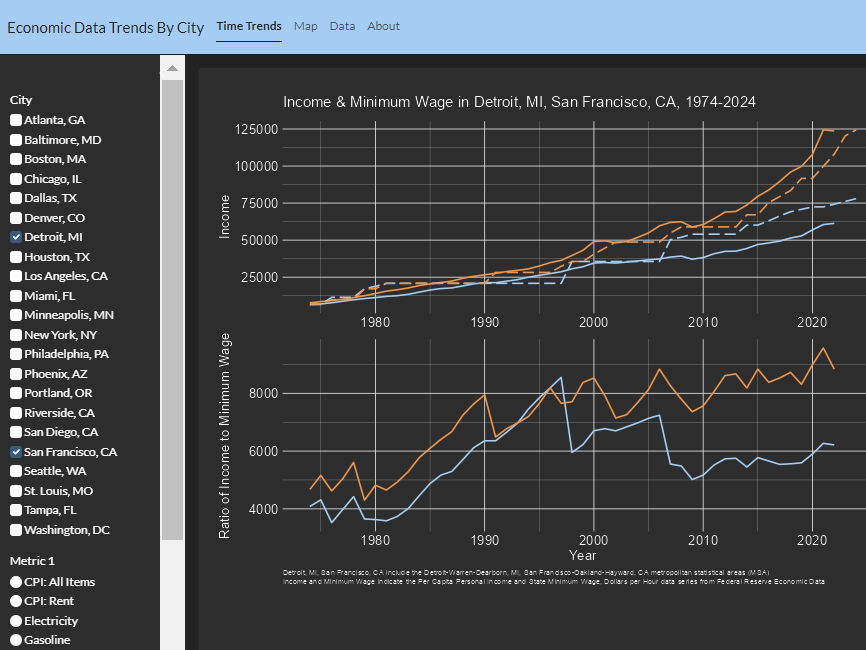
Time Trends: Creates line graphs of 1-2 economic metrics by year, stratified by city. The ratio of selected metrics can be plotted by year to display relative change.
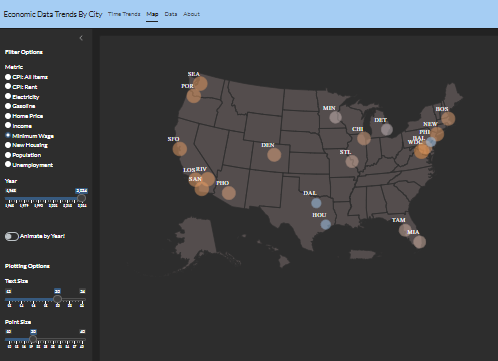
Map: Creates maps displaying an economic metric for a given year. The plot can be animated to show changes across years.
Example questions that can be explored through the application:
How has the relationship between home price and new housing units in San Francisco, CA and Detroit, MI changed overtime?
How has minimum wage changed over time across the United States?
Full Description: # Economic Data Trends By City
This application is designed to allow users to explore a variety of economic statistics by United States city. These metrics can be visualized over time, in reference to other metrics, and/or by mapping.
This app includes 4 pages:
- Time Trends: Creation of line graph plotting 1 or 2 economic metrics by year, stratified by selected cities. Ratio of 2 selected metrics can also be plotted by year to display relative change.
- Map: Creation of United States map displaying an economic metric for a given year. Plot can be animated to show changes by year.
- Data: Allows user to see and search data supplied to graphs.
- About: Application information and links.
A Motivating Example: Change in Home Price and New Housing
How has the relationship between home price and new housing units in San Francisco, CA and Detroit, MI changed overtime?
Using the Time Trends tab, we can select the cities (Detroit, MI, San Francisco, CA) and metrics of interest (Home Price, New Housing) to show many aspects of these metrics in these cities.
A Motivating Example: Change in Minimum Wage
How has minimum wage changed over time across the United States?
Using the Map tab, we can select Minimum Wage and 1985 for the year to show what the minimum wage was in major cities across the United States in 1985. We can also hover over each city to see the minimum wage value.
Data Source
All data is sourced from the Federal Reserve Bank of St. Louis. Additonal data sources may be added to future versions of this application.
This product uses the FRED® API but is not endorsed or certified by the Federal Reserve Bank of St. Louis. By using this application, users agree to the FRED® API Terms of Use.
Data Dictionary
Cities: Although the application refers to cities throughout, unless otherwise specified, metrics are sourced as the value for the metropolitan statistical area (MSA) which includes the city itself as well as the surrounding areas. The 22 largest MSAs were selected for the dataset.
Metrics: Metrics are economic indication values for each MSA in each year. If data is available for shorter time periods (i.e., quarter or month), the median value for the year is used for the dataset. More information is available on each metric by searching the metric description on the Federal Reserve of St. Louis website.
Authors
Stephen Uong - GitHub: phispu - spp.uong@gmail.com
Stephen is a PhD candidate in epidemiology at Columbia University in New York, NY.
Jenny Dusendang - GitHub: jrdusendang - jdusendang@gmail.com
Jenny is a Data Scientist working on epidemiology projects in Oakland, CA.
Version
1.0.0 released on 9/15/2024
Shiny app: https://phispu.shinyapps.io/app-cpi/
Repo: GitHub - phispu/app-cpi-eda
Thumbnail:
Full image: