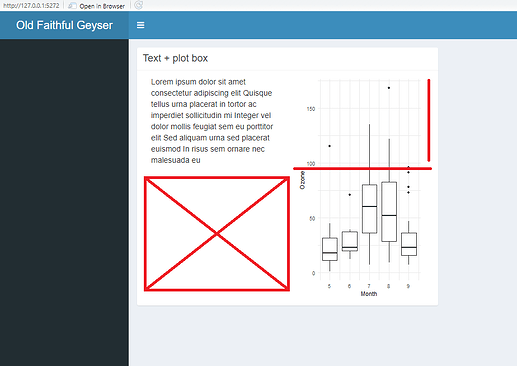
I have a dashboardPage with a box. The box is split into 2 columns: one for text, another for a plot. How can I dynamically set the height of the plot in renderPlot() to match the height of the text (i.e. to avoid blank space under the text)?
library(shiny)
library(shinydashboard)
library(shinydashboardPlus)
library(ggplot2)
library(shinipsum)

# Define UI for application that draws a histogram
ui <- shinydashboardPlus::dashboardPage(

    # Application title
    header = shinydashboardPlus::dashboardHeader(title = "Old Faithful Geyser Data"),

    # Sidebar with a slider input for number of bins
    sidebar = shinydashboardPlus::dashboardSidebar(),
    body = shinydashboard::dashboardBody(
        fluidRow(
            shinydashboardPlus::box(
                title = "Text + plot box",
                column(width = 6,
                       textOutput(outputId = "text")),
                column(width = 6,
                       plotOutput(outputId = "ran_plot"))

            )

        )
    )

)

# Define server logic required to draw a histogram
server <- function(input, output) {
    output$text <- renderText({
        shinipsum::random_text(nwords = 40)
    })

    output$ran_plot <- renderPlot({
        shinipsum::random_ggplot()
    })

}

# Run the application
shinyApp(ui = ui, server = server)
There is certainly a better way that would involve using javascript to determine the text output size, and basing the plot on that.
Or of stipulating the text size dynamically based on the text and analysis thereof, and then using that on the plot also.
But aside from that here is a rough approach based on some assumption that there is some linear relationship between your typical text content and its plotted height.
library(shiny)
library(shinydashboard)
library(shinydashboardPlus)
library(ggplot2)
library(shinipsum)

# Define UI for application that draws a histogram
ui <- shinydashboardPlus::dashboardPagePlus(

  # Application title
  header = shinydashboardPlus::dashboardHeaderPlus(title = "Old Faithful Geyser Data"),

  # Sidebar with a slider input for number of bins
  sidebar = shinydashboard::dashboardSidebar(),
  body = shinydashboard::dashboardBody(
    fluidRow(sliderInput("nwords",label="How many words?",min=1,max=300,value=40)),
    fluidRow(sliderInput("scale_factor",label="scale factor ?",min=.1,max=4,value=2,step=.1)),
    fluidRow(
      shinydashboard::box(
        title = "Text + plot box",
        column(width = 6,
               textOutput(outputId = "text")),
        column(width = 6,
               plotOutput(outputId = "ran_plot"))

      )

    )
  )

)

# Define server logic required to draw a histogram
server <- function(input, output) {
  randtext <- reactive({
    shinipsum::random_text(nwords = req(input$nwords))
  })


  output$text <- renderText({
    req(randtext())
  })

  output$ran_plot <- renderPlot({
    shinipsum::random_ggplot()
  }, height=function(){req(input$scale_factor)*req(input$nwords)})

}

# Run the application
shinyApp(ui = ui, server = server)
1 Like
Thank you for the suggestion!
Unfortunately, it does not work as I want it to be. Scale-factor can't be set as a constant because it depends on the app window size and screen resolution.
As there is no simple solution, I will just set a constant plot size and work on the text positioning to make it prettier. At least for the moment)
Anyway, thanks again!
