I am trying to plot a dual y axis plot using the following code:
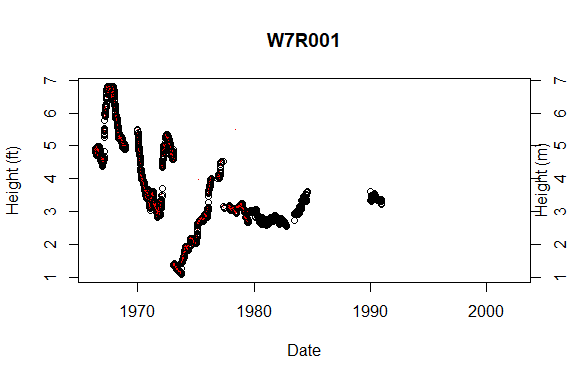
plot(dataset1, col="black", ylab="Height (ft)", main = "W7R001")
par(new = TRUE)
points(dataset5, col="red", pch = ".", xlab="", ylab="", axes = FALSE)
axis(side = 4)
mtext(side = 4, "Height (m)").
My issue now is that, on the secondary plot, the label of the secondary y axis lies on the secondary y axis vales. How do I fix or avoid this?
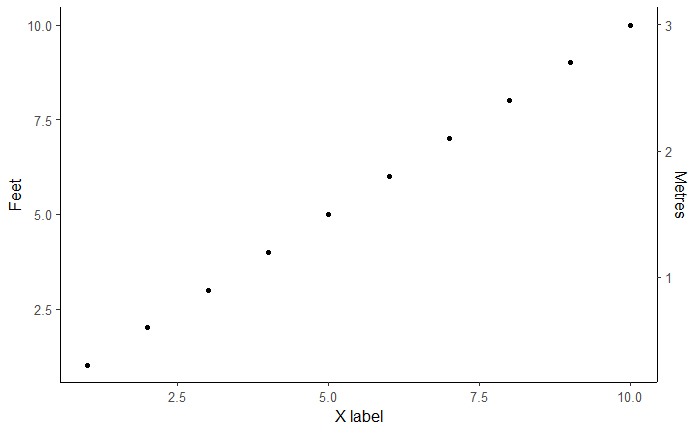
I directed you to the help for base plotting because you used base R in your question. If you use ggplot2 at all, you might be interested to know you can also do the same like this
ggplot(tibble(x = 1:10, y = 1:10), aes(x, y)) +
  geom_point() +
  scale_y_continuous(sec.axis = sec_axis(~. * 0.3,  name = 'Metres')) +
  labs(x = 'X label', y = 'Feet')