i can't post the reprex of this issue as it is entirely related to ms SQL stored procedure. what i need is just an idea to get it done.
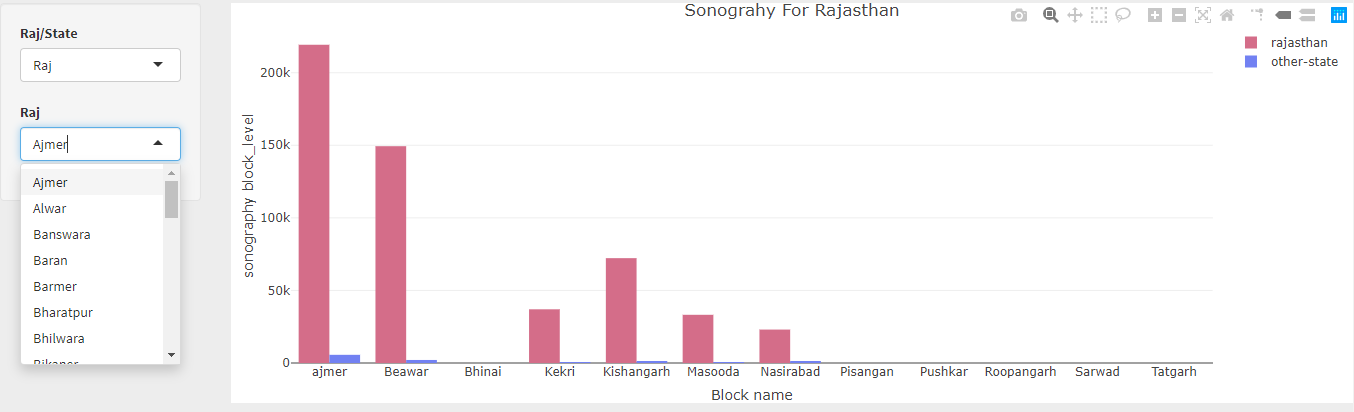
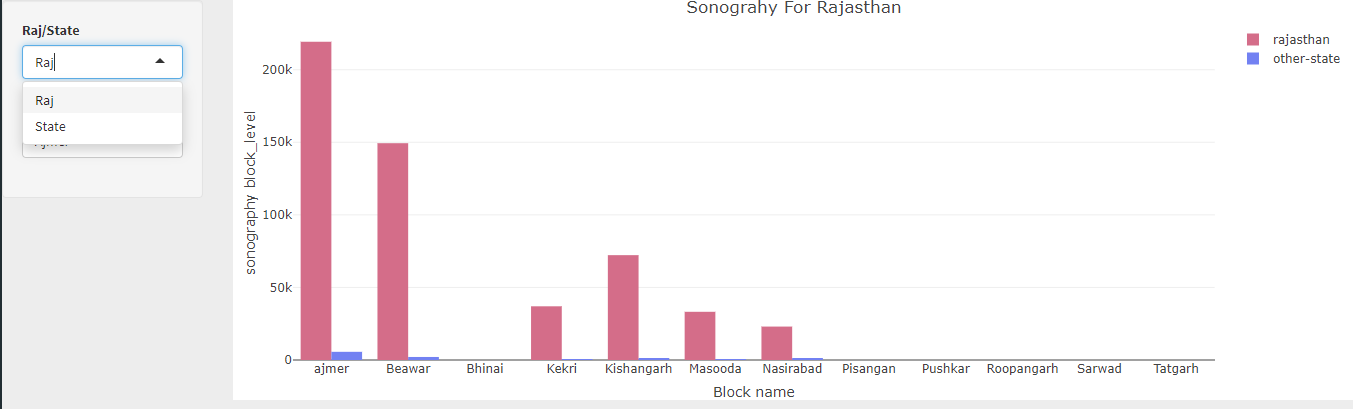
issue:- i have created a drop-down box where you can select either state or other-state when you click on state, it takes data from one stored procedure and when you click on other-state, it fetches the data from another sp.then it further renders the drop-down list in another drop-down list below it, and so on. what i need to add to make it work, i know,it's kinda tough though as there is no explanation of sp and how parameters are being passed.
1.plot the chart when a specific value is selected from the sub-drop-down list as per the argument passed to sp of my selection.
i am very close to achieving it but doing something wrong in sp parameter, could anyone just give me an idea where i am going wrong.
output$newpage1<-renderPlotly({

dbcnd <- odbcDriverConnect('Driver={SQL Server};Server=;Database=;Uid=;Pwd=')
   qrydd<-paste("exec db..[sp]'','','','','0','0','0','','','",input$date[1],"','",input$date[2],"'")
    qrydd
    dtd <- sqlQuery(dbcnd,qrydd)
    dtd <- data.frame(dtd)
    dtd
    closeAllConnections()

qrydd1<-paste("exec db..[sp]'','','','','0','0','2','0','','",input$date[1],"','",input$date[2],"'")
    qrydd1
    dtd1 <- sqlQuery(dbcnd,qrydd1)
    dtd1 <- data.frame(dtd1)
    dtd1
    closeAllConnections()

   Values = c(dtd$DID)
   names(Values) = as.list(as.character(dtd$DistrictName))

   values1=c(dtd1$StateCode)
   names(values1)=as.list(as.character(dtd1$StateName))

  countyData = list("Raj"=Values,"State"=values1)

   output$FirstChoice <- renderUI ({
      selectInput(inputId = "FirstChoice",label = "Raj/State",
                  choices = c("Raj","State"))
   })

   output$SecondChoice <- renderUI ({

    if (input$FirstChoice == "Raj"){lab <- "Raj"}
    else if (input$FirstChoice == "State") {lab <- "State"}
    else {lab <- "dependant"}

    selectInput(inputId = "SecondChoice", label = lab,
                choices = c(get(input$FirstChoice,countyData)))

  })
    qrydd=paste("exec db..[sp]'','','','',",input$SecondChoice,",'3','0','','','",input$date[1],"','",input$date[2],"'")

    qrydd
    dtd <- sqlQuery(dbcnd,qrydd)
    dtd <- data.frame(dtd)
    dtd
    closeAllConnections()

    data <- data.frame(dtd$BlockName, dtd$TotFormFRaj, dtd$TotFormFOtherState)

    p <- plot_ly(dtd, x = dtd$BlockName, y = dtd$TotFormFRaj, type = 'bar', name = 'rajasthan',marker = list(color = '#CE6D8B')) %>%
      add_trace(y = dtd$TotFormFOtherState, name = 'other-state',marker = list(color = '#7484F7')) %>%
      layout(yaxis = list(title = 'sonography block_level'),xaxis = list(title = 'Block name'), barmode = 'group',title='Sonograhy For Rajasthan')

})