Hi there!
geom_smooth() seems to work either for all levels or for none. There is any way for geom_smooth() to draw the lines for the different levels independently of each other?
In the reprex below you can see that, for the first example, geom_smooth works for both "a" and "b" levels. In the second example, I use the formula = y ~ poly(x, 4), which requires 5 or more points to draw a line. This means "b" could show a line, and "a" couldn't, but nothing is shown.
Thanks in advance for the help!
library(tidyverse)
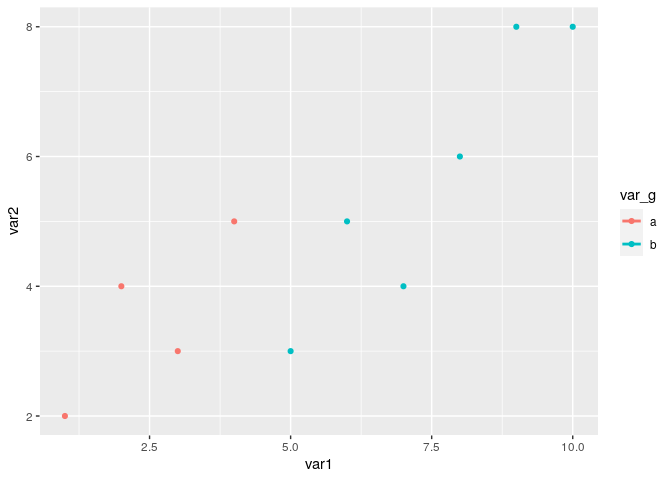
DF = data.frame(
stringsAsFactors = FALSE,
var1 = c(1L, 2L, 3L, 4L, 5L, 6L, 7L, 8L, 9L, 10L),
var2 = c(2L, 4L, 3L, 5L, 3L, 5L, 4L, 6L, 8L, 8L),
var_g = c("a", "a", "a", "a", "b", "b", "b", "b", "b", "b")
)
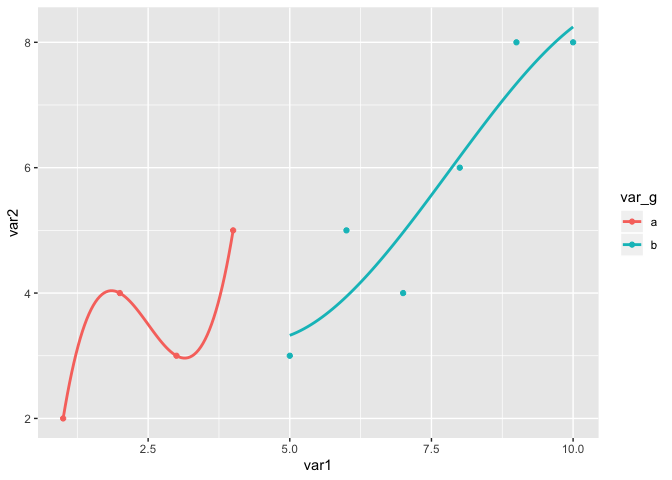
# Works
DF %>%
ggplot(aes(var1, var2, color = var_g)) +
geom_point() +
geom_smooth(method = "lm", formula = y ~ poly(x, 3), se = FALSE)

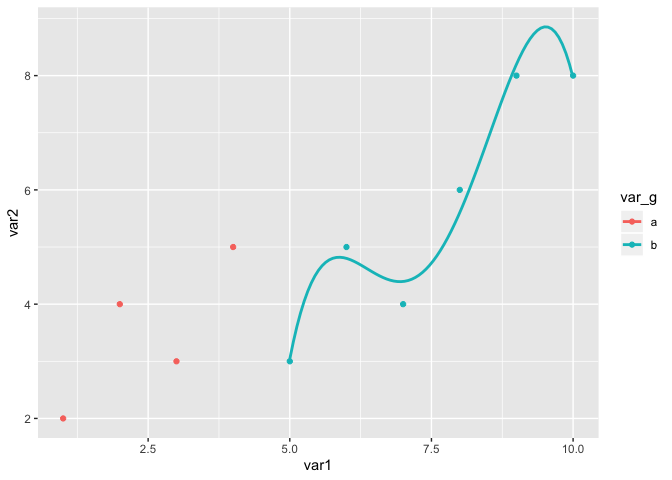
# Does not work
DF %>%
  ggplot(aes(var1, var2, color = var_g)) +
  geom_point() +
  geom_smooth(method = "lm", formula = y ~ poly(x, 4), se = FALSE)
#> Warning: Computation failed in `stat_smooth()`:
#> 'degree' must be less than number of unique points
Created on 2020-03-19 by the reprex package (v0.3.0)