Hi all
This is my first time using shiny, and I want to make a straightforward web app for students (students are children, so I need a simple web app). I want to draw a magic matrix. The student changes the N value, and he gets the result as a table.
I used a library called magic.
library(magic)
magicMatrix <- magic (n)
But I have a problem with changing n! I could not change n or render magicMatrix.
library(shiny)
library(magic)
library(ggplot2)
ui <- fluidPage(
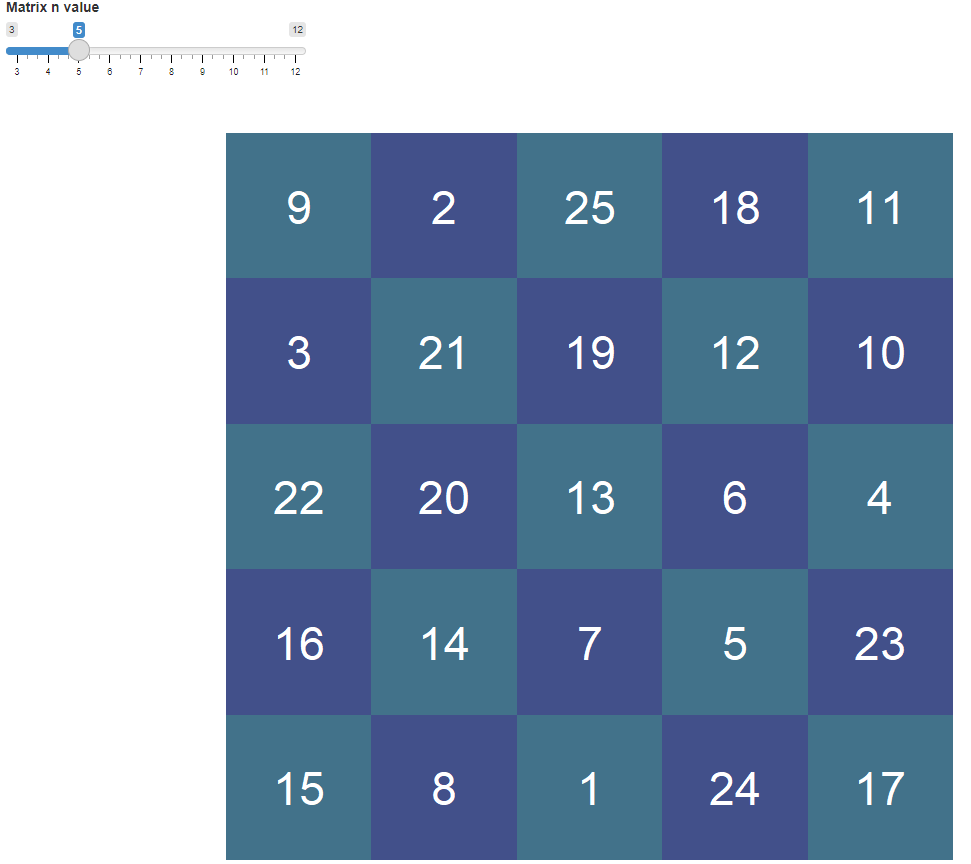
sliderInput("inputN", "Matrix n value", 3, 12, 3),
plotOutput("ggplot", height = "800px")
)
server <- function(input, output, session){
output$ggplot = renderPlot({
#Get the n-value
n = input$inputN
#Get the magic matrix and convert it into a table with xy coordinates
myNumbers = data.frame(
number = c(t(magic(n))),
x = 1:n,
y = rep(n:1, each = n)
)
#Plot it
ggplot() +
#Create a background pattern of tiles
geom_tile(data = expand.grid(x = 1:n, y = 1:n),
aes(x, y, fill = as.factor((x+y) %% 2))) +
scale_fill_manual(values = c("#42728a", "#42508a")) +
#Add the magic numbers as text
geom_text(data = myNumbers,
aes(x, y, label = number),
color = "white", size = 80/n) +
#Set plot option to hide all extra info like axes / legend
theme_void() + coord_fixed() +
theme(legend.position = "none")
})
}
shinyApp(ui, server)
Setting the height option in the plotOutput is optional, but you can make the plot bigger that way if you like, You'll need to play with the size = 80/n value in the geom_text in order to have the text appear the right size in the grid should you change it