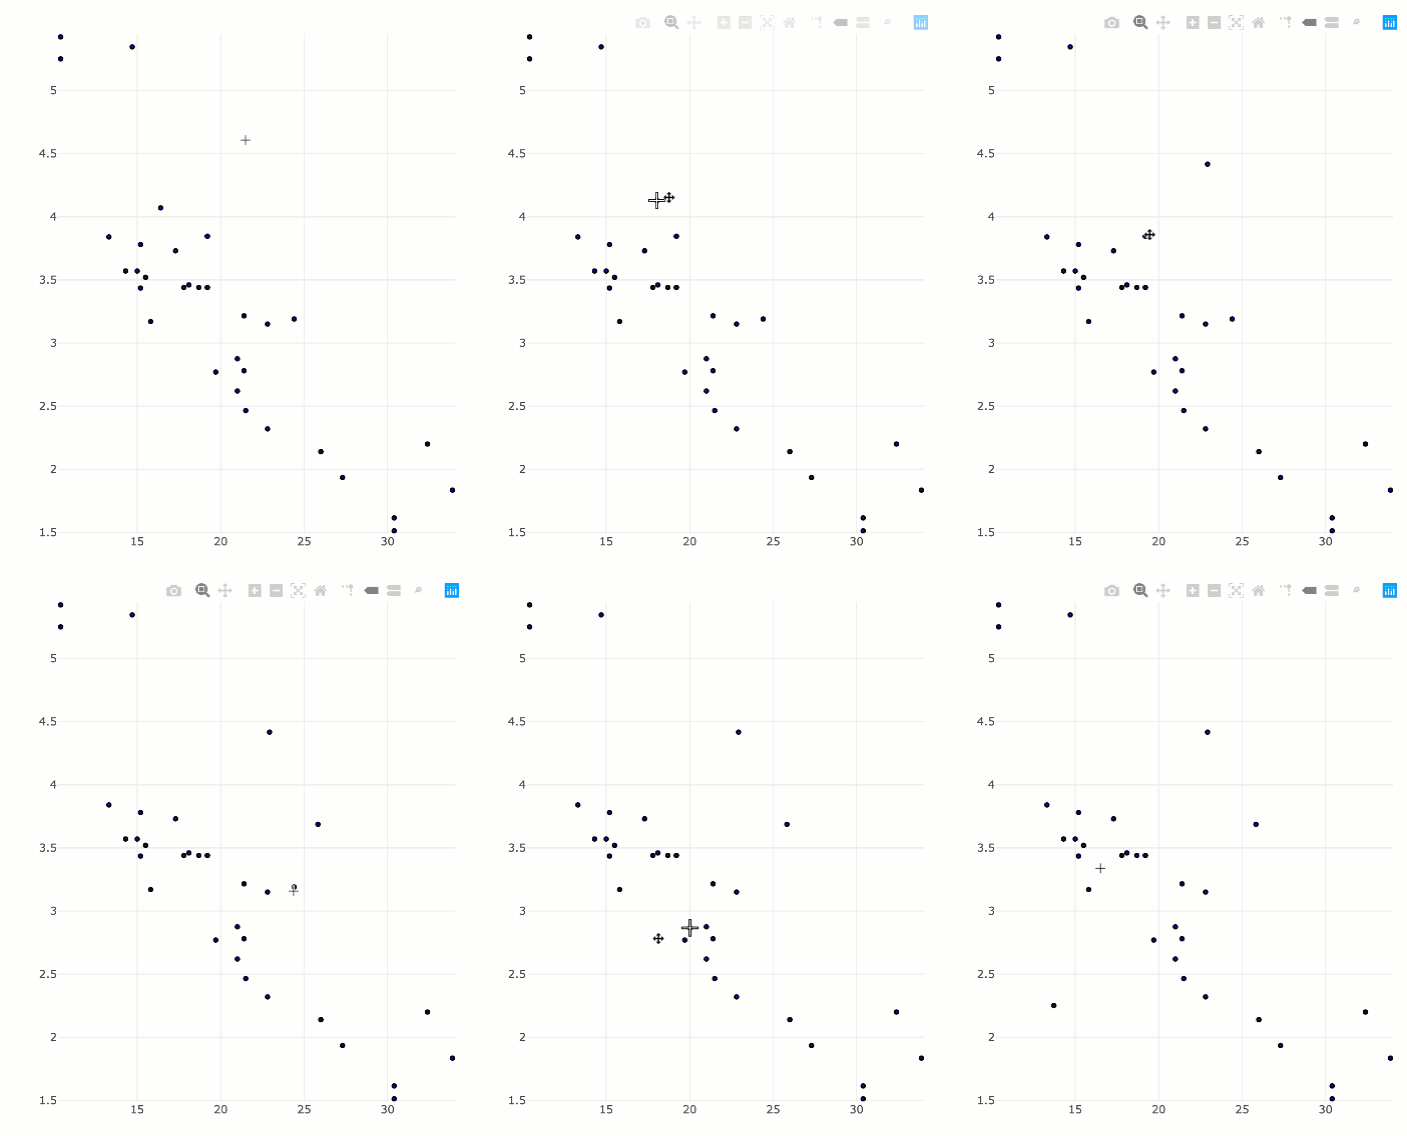
Sure, you'll need to pass multiple circle shapes to the layout(), then use config() to make them editable. The hard part is understanding how to create a suitable list of circles -- these are a special case of plotly.js shapes that are documented here -- Single-page reference in R
library(plotly)
library(purrr)

# creates a list of 32 circle shapes (one for each row/car)
circles <- map2(
  mtcars$mpg,
  mtcars$wt,
  ~list(
    type = "circle",
    # anchor circles at (mpg, wt)
    xanchor = .x,
    yanchor = .y,
    # give each circle a 2 pixel diameter
    x0 = -2, x1 = 2,
    y0 = -2, y1 = 2,
    xsizemode = "pixel",
    ysizemode = "pixel",
    # other visual properties
    fillcolor = "blue",
    line = list(color = "transparent")
  )
)

plot_ly() %>%
  layout(shapes = circles) %>%
  config(edits = list(shapePosition = TRUE))
