Hi, I have trouble with dot_sankey plot and need help with my script.
this is my data:
structure(list(Pathway = c("Alpha-amino acid biosynthetic proc. ",
"Carboxylic acid biosynthetic proc. ", "Organic acid biosynthetic proc. ",
"Small molecule biosynthetic proc. ", "Carboxylic acid metabolic proc. ",
"Oxoacid metabolic proc. ", "Organic acid metabolic proc. ",
"Small molecule metabolic proc. ", "Cellular catabolic proc. ",
"Catabolic proc. "), GeneRatio = c(0.133333333333333, 0.0668693009118541,
0.0664652567975831, 0.0558375634517767, 0.0427263479145473, 0.0426164519326065,
0.0418287937743191, 0.0377066115702479, 0.0324729392173189, 0.0299465240641711
), FDR = c(3.8517556300416, 4.94174664623985, 4.94174664623985,
5.91926984684473, 5.20765687373531, 5.20765687373531, 5.19008290917224,
7.78847331776209, 5.91926984684473, 5.20765687373531), GeneID = c("ASNS/CTH/ASS1/PSAT1/CBS/ATP2B4/OAT/PHGDH/MTHFD1/PLOD3",
"ASNS/CTH/ASS1/ACLY/PSAT1/OXSM/CBS/NA/CASP1/ATP2B4/MTHFD1/KYNU/OLAH/AKR1C3/OAT/PHGDH/PLOD3/HSD17B12/FABP5/ERLIN2/PRMT3/CBR1",
"ASNS/CTH/ASS1/ACLY/PSAT1/OXSM/CBS/NA/CASP1/ATP2B4/MTHFD1/KYNU/OLAH/AKR1C3/OAT/PHGDH/PLOD3/HSD17B12/FABP5/ERLIN2/PRMT3/CBR1",
"ASNS/COQ9/COQ5/CTH/COQ6/ASS1/ACLY/PSAT1/OXSM/CBS/FDXR/PC/NA/CASP1/ATP2B4/MTHFD1/KYNU/ERLIN2/OLAH/AKR1C3/OAT/PHGDH/PLOD3/ALDOC/HSD17B12/ADK/FABP5/PTPN2/PRMT3/SIRT5/AACS/ACSS3/CBR1",
"ACAA1/OAT/ASNS/ARG2/QPRT/FAH/ALDOC/KYNU/CTH/ASS1/ACLY/HSD17B4/PSAT1/IDH1/EPHX1/OXSM/CBS/PC/AKR1C3/NA/DLD/CASP1/ATP2B4/MTHFD1/ALDH1L2/OLAH/FOXK1/ACAD9/GPX1/LYPLA2/AACS/PHGDH/PLOD3/SLC27A1/HSD17B12/FABP5/GFPT1/NUDT19/ERLIN2/PRMT3/GSS/CBR1",
"ACAA1/OAT/ASNS/ARG2/QPRT/FAH/ALDOC/KYNU/CTH/ASS1/ACLY/HSD17B4/PSAT1/IDH1/EPHX1/OXSM/CBS/PC/AKR1C3/NA/DLD/CASP1/ATP2B4/MTHFD1/ALDH1L2/OLAH/FOXK1/ACAD9/GPX1/LYPLA2/AACS/PHGDH/PLOD3/SLC27A1/HSD17B12/FABP5/GFPT1/NUDT19/ERLIN2/PRMT3/GSS/ABHD14B/CBR1",
"ACAA1/OAT/ASNS/ARG2/QPRT/FAH/ALDOC/KYNU/CTH/ASS1/ACLY/HSD17B4/PSAT1/IDH1/EPHX1/OXSM/CBS/PC/AKR1C3/NA/DLD/CASP1/ATP2B4/MTHFD1/ALDH1L2/OLAH/FOXK1/ACAD9/GPX1/LYPLA2/AACS/PHGDH/PLOD3/SLC27A1/HSD17B12/FABP5/GFPT1/NUDT19/ERLIN2/PRMT3/GSS/ABHD14B/CBR1",
"ACAA1/OAT/ASNS/ARG2/COQ9/MTHFD1/QPRT/FAH/NAMPT/ALDOC/COQ5/KYNU/CTH/COQ6/NUDT10/PPCS/ASS1/ACLY/HSD17B4/PSAT1/IDH1/EPHX1/OXSM/CBS/FLAD1/FDXR/DCXR/PC/IMPDH2/FUCA1/CA13/AKR1C3/NUDT11/GFPT1/NA/DLD/SNX17/CASP1/AIFM2/ATP2B4/DGUOK/ALDH1L2/UCK2/ERLIN2/OLAH/CBR1/FOXK1/ACAD9/GPX1/BAD/LYPLA2/MAT2B/SCARB1/AACS/PHGDH/PLOD3/HDLBP/CAT/SLC27A1/ HSD17B12/ADK/FABP5/PTPN2/NUDT19/BRAT1/PRMT3/SIRT5/DIP2A/ERH/GSS/ACSS3/ABHD14B/NEIL2",
"ACAA1/OAT/NEDD4/ARG2/DIS3/ACHE/HMOX1/PYGL/TIMP1/QPRT/FAH/UBE2S/SKP1/KYNU/CLU/CAT/NUDT10/PSME3/HSD17B4/STAM/PCYOX1L/CLGN/FBXL18/AGL/ERAP1/FBXO22/TMUB2/GUSB/UBE2L3/LONP1/NUDT11/PSMB10/FIS1/GPX1/NA/HGS/LYPLA2/ATP2B4/GPC1/FAP/DLD/PON2/WFS1/RBM24/OPTN/RBM38/HSPBP1/GSTM3/ALDH1L2/TGFB1I1/ERLIN2/DFFA/CBS/FOXK1/BCL2/TBK1/AKR1C3/SCARB1/SRPX/UCHL3/IDH1/RCN3/EPHX1/NUDT19/STX12/UFM1/ITGB4/CPTP/METTL3/FUCA1/SNX5/BAD/HAX1/PRKCA/NEIL2/MTMR14",
"LYPLA2/ACAA1/OAT/NEDD4/ARG2/DIS3/ACHE/HMOX1/PYGL/TIMP1/QPRT/FAH/UBE2S/ALDOC/SKP1/KYNU/CLU/CAT/NUDT10/PSME3/HSD17B4/STAM/PCYOX1L/CLGN/FBXL18/AGL/ERAP1/FBXO22/TMUB2/GUSB/FUCA1/UBE2L3/LONP1/NUDT11/PSMB10/FIS1/GPX1/NA/SNX17/HGS/ATP2B4/GPC1/FAP/DLD/PON2/WFS1/RBM24/UCHL3/OPTN/RBM38/HSPBP1/GSTM3/ALDH1L2/TGFB1I1/ERLIN2/DFFA/CBS/FOXK1/BCL2/TBK1/AKR1C3/HSD17B11/BAD/FYN/SCARB1/SRPX/CDK4/IDH1/RCN3/EPHX1/NUDT19/STX12/UFM1/ITGB4/CPTP/METTL3/SNX5/NAGLU/HAX1/PRKCA/NEIL2/MTMR14"
), Count = c(10L, 22L, 22L, 33L, 42L, 43L, 43L, 73L, 78L, 84L
)), class = "data.frame", row.names = c(NA, -10L))
                               Pathway  GeneRatio      FDR
1 Alpha-amino acid biosynthetic proc.  0.13333333 3.851756
2  Carboxylic acid biosynthetic proc.  0.06686930 4.941747
3     Organic acid biosynthetic proc.  0.06646526 4.941747
4   Small molecule biosynthetic proc.  0.05583756 5.919270
5     Carboxylic acid metabolic proc.  0.04272635 5.207657
6             Oxoacid metabolic proc.  0.04261645 5.207657
                                                                                                                                                                                                                                                GeneID
1                                                                                                                                                                                                ASNS/CTH/ASS1/PSAT1/CBS/ATP2B4/OAT/PHGDH/MTHFD1/PLOD3
2                                                                                                                           ASNS/CTH/ASS1/ACLY/PSAT1/OXSM/CBS/NA/CASP1/ATP2B4/MTHFD1/KYNU/OLAH/AKR1C3/OAT/PHGDH/PLOD3/HSD17B12/FABP5/ERLIN2/PRMT3/CBR1
3                                                                                                                           ASNS/CTH/ASS1/ACLY/PSAT1/OXSM/CBS/NA/CASP1/ATP2B4/MTHFD1/KYNU/OLAH/AKR1C3/OAT/PHGDH/PLOD3/HSD17B12/FABP5/ERLIN2/PRMT3/CBR1
4                                                                   ASNS/COQ9/COQ5/CTH/COQ6/ASS1/ACLY/PSAT1/OXSM/CBS/FDXR/PC/NA/CASP1/ATP2B4/MTHFD1/KYNU/ERLIN2/OLAH/AKR1C3/OAT/PHGDH/PLOD3/ALDOC/HSD17B12/ADK/FABP5/PTPN2/PRMT3/SIRT5/AACS/ACSS3/CBR1
5         ACAA1/OAT/ASNS/ARG2/QPRT/FAH/ALDOC/KYNU/CTH/ASS1/ACLY/HSD17B4/PSAT1/IDH1/EPHX1/OXSM/CBS/PC/AKR1C3/NA/DLD/CASP1/ATP2B4/MTHFD1/ALDH1L2/OLAH/FOXK1/ACAD9/GPX1/LYPLA2/AACS/PHGDH/PLOD3/SLC27A1/HSD17B12/FABP5/GFPT1/NUDT19/ERLIN2/PRMT3/GSS/CBR1
6 ACAA1/OAT/ASNS/ARG2/QPRT/FAH/ALDOC/KYNU/CTH/ASS1/ACLY/HSD17B4/PSAT1/IDH1/EPHX1/OXSM/CBS/PC/AKR1C3/NA/DLD/CASP1/ATP2B4/MTHFD1/ALDH1L2/OLAH/FOXK1/ACAD9/GPX1/LYPLA2/AACS/PHGDH/PLOD3/SLC27A1/HSD17B12/FABP5/GFPT1/NUDT19/ERLIN2/PRMT3/GSS/ABHD14B/CBR1
  Count
1    10
2    22
3    22
4    33
5    42
6    43
and this is my code:
install.packages("ggplot2")
install.packages("dplyr")
install.packages("ggalluvial") # For Sankey-like plots
install.packages("tidyr") # For unnest function
library(dplyr) # For data manipulation
library(tidyr) # For separate_rows function
data <- read.csv(file = "C:/Users/Sofia/Downloads/data.csv", sep=";")
sankey_dot <- function(data,
sankey.text.size = 3,
sankey.x.axis.text.position = 1,
sankey.x.axis.text.size = 12,
molecule.label = "GeneID",
dot.color = "Count",
dot.position = 6,
dot.label = "Pathway",
dot.text.size = 12,
dot.scale = 0.72,
dot.x = 0.59,
dot.y = -0.173,
dot.width = 0.48,
dot.height = 1.33,
...) {
Data collation after KEGG or GO enrichment analysis
data3 <- data %>%
dplyr::select("GeneID", "Pathway", "FDR", "Count", "FoldEnrichment") %>%
dplyr::distinct() %>%
dplyr::arrange(FDR, descreasing = TRUE)
data3$FoldEnrichment <- data3$FoldEnrichment %>% round(digits = 2)
bubble chart
if (dot.label == "Pathway") {
p1 <- ggplot(
data = data3,
aes(
x = FoldEnrichment,
y = stats::reorder(Pathway, FoldEnrichment)
)
) +
geom_point(aes(size = Count, color = -log10(FDR))) +
scale_size_continuous(range = c(2, 6)) +
theme_bw() +
theme(
axis.text.x = element_text(
size = "Count",
colour = "black", vjust = 1
),
axis.text.y = element_text(
size = "Count",
colour = "black", hjust = 1
)
) +
scale_colour_distiller(palette = dot.color, direction = -1) +
labs(x = "FoldEnrichment", y = "") +
theme_bw() +
theme(
axis.title = element_text(size = 12),
axis.text = element_text(size = 11),
axis.text.y = element_blank(),
axis.ticks.y = element_blank(),
legend.title = element_text(size = 10),
legend.text = element_text(size = 8)
)
} else if (dot.label == "GeneID") {
p1 <- ggplot(
data = data3,
aes(
x = FoldEnrichment,
y = stats::reorder(GeneID, FoldEnrichment)
)
) +
geom_point(aes(size = Count, color = -log10(FDR))) +
scale_size_continuous(range = c(2, 6)) +
theme_bw() +
theme(
axis.text.x = element_text(
size = "Count",
colour = "black", vjust = 1
),
axis.text.y = element_text(
size = "Count",
colour = "black", hjust = 1
)
) +
scale_colour_distiller(palette = dot.color, direction = -1) +
labs(x = "FoldEnrichment", y = "") +
theme_bw() +
theme(
axis.title = element_text(size = 12),
axis.text = element_text(size = 11),
axis.text.y = element_blank(),
axis.ticks.y = element_blank(),
legend.title = element_text(size = 10),
legend.text = element_text(size = 8)
)
}
data_sankey <- data %>%
dplyr::arrange(FoldEnrichment, descreasing = FALSE) %>%
dplyr::select(herb, molecule_id, target, dot.label) %>%
as.data.frame() %>%
dplyr::distinct()
df <- data_sankey %>% ggsankey::make_long(colnames(data_sankey))
if (dot.label == "Description" && molecule.label == "molecule_id") {
df$node <- factor(df$node, levels = c(
data_sankey$Description %>% unique(),
data_sankey$target %>% unique(),
data_sankey$molecule_id %>% unique(),
data_sankey$herb %>% unique()
))
} else if (dot.lable == "ID" && molecule.lable == "molecule_id") {
df$node <- factor(df$node, levels = c(
data_sankey$ID %>% unique(),
data_sankey$target %>% unique(),
data_sankey$molecule_id %>% unique(),
data_sankey$herb %>% unique()
))
} else if (dot.lable == "Description" && molecule.lable == "molecule") {
df$node <- factor(df$node, levels = c(
data_sankey$Description %>% unique(),
data_sankey$target %>% unique(),
data_sankey$molecule_id %>% unique(),
data_sankey$herb %>% unique()
))
} else if (dot.lable == "ID" && molecule.lable == "molecule") {
df$node <- factor(df$node, levels = c(
data_sankey$ID %>% unique(),
data_sankey$target %>% unique(),
data_sankey$molecule %>% unique(),
data_sankey$herb %>% unique()
))
}
color settings
mycol <- cols4all::c4a("rainbow_wh_rd", length(unique(df$node)))
mycol2 <- sample(mycol, length(mycol))
Sankey diagram
p2 <- ggplot(df, aes(
x = x,
next_x = next_x,
node = node,
next_node = next_node,
fill = node,
label = node
)) +
ggsankey::geom_sankey(
flow.alpha = 0.5,
node.color = NA,
show.legend = FALSE
) +
ggsankey::geom_sankey_text(
size = sankey.text.size,
color = "black",
hjust = 1,
position = position_nudge(x = -0.05)
) +
ggsankey::theme_sankey(base_size = 20, base_family = "sans") +
scale_fill_manual(values = mycol2) +
theme(axis.title = element_blank()) +
theme(axis.text.x = element_text(
size = sankey.x.axis.text.size,
hjust = sankey.x.axis.text.position,
vjust = 10, colour = "black"
))
p3 <- p2 + theme(plot.margin = unit(c(0, dot.position, 0, 0), units = "cm"))
p4 <- cowplot::ggdraw() +
cowplot::draw_plot(p3) +
cowplot::draw_plot(p1,
scale = dot.scale,
x = dot.x, y = dot.y,
width = dot.width,
height = dot.height
)
return(p4)
}
Can anyone help me to have an input like this?
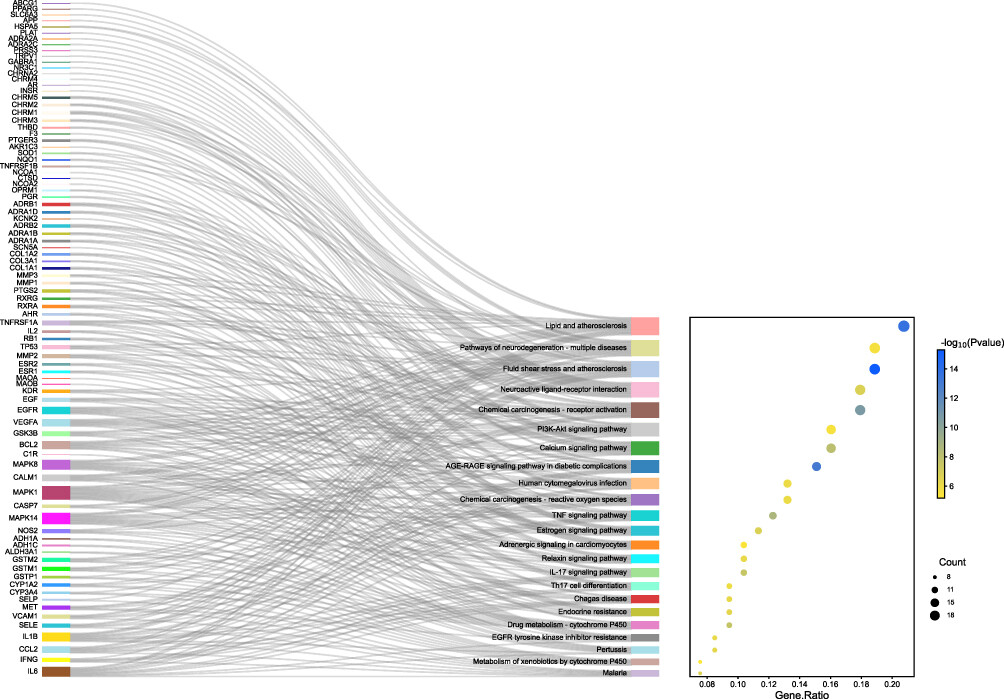
thank you