Document term matrix in XGBoost classifier

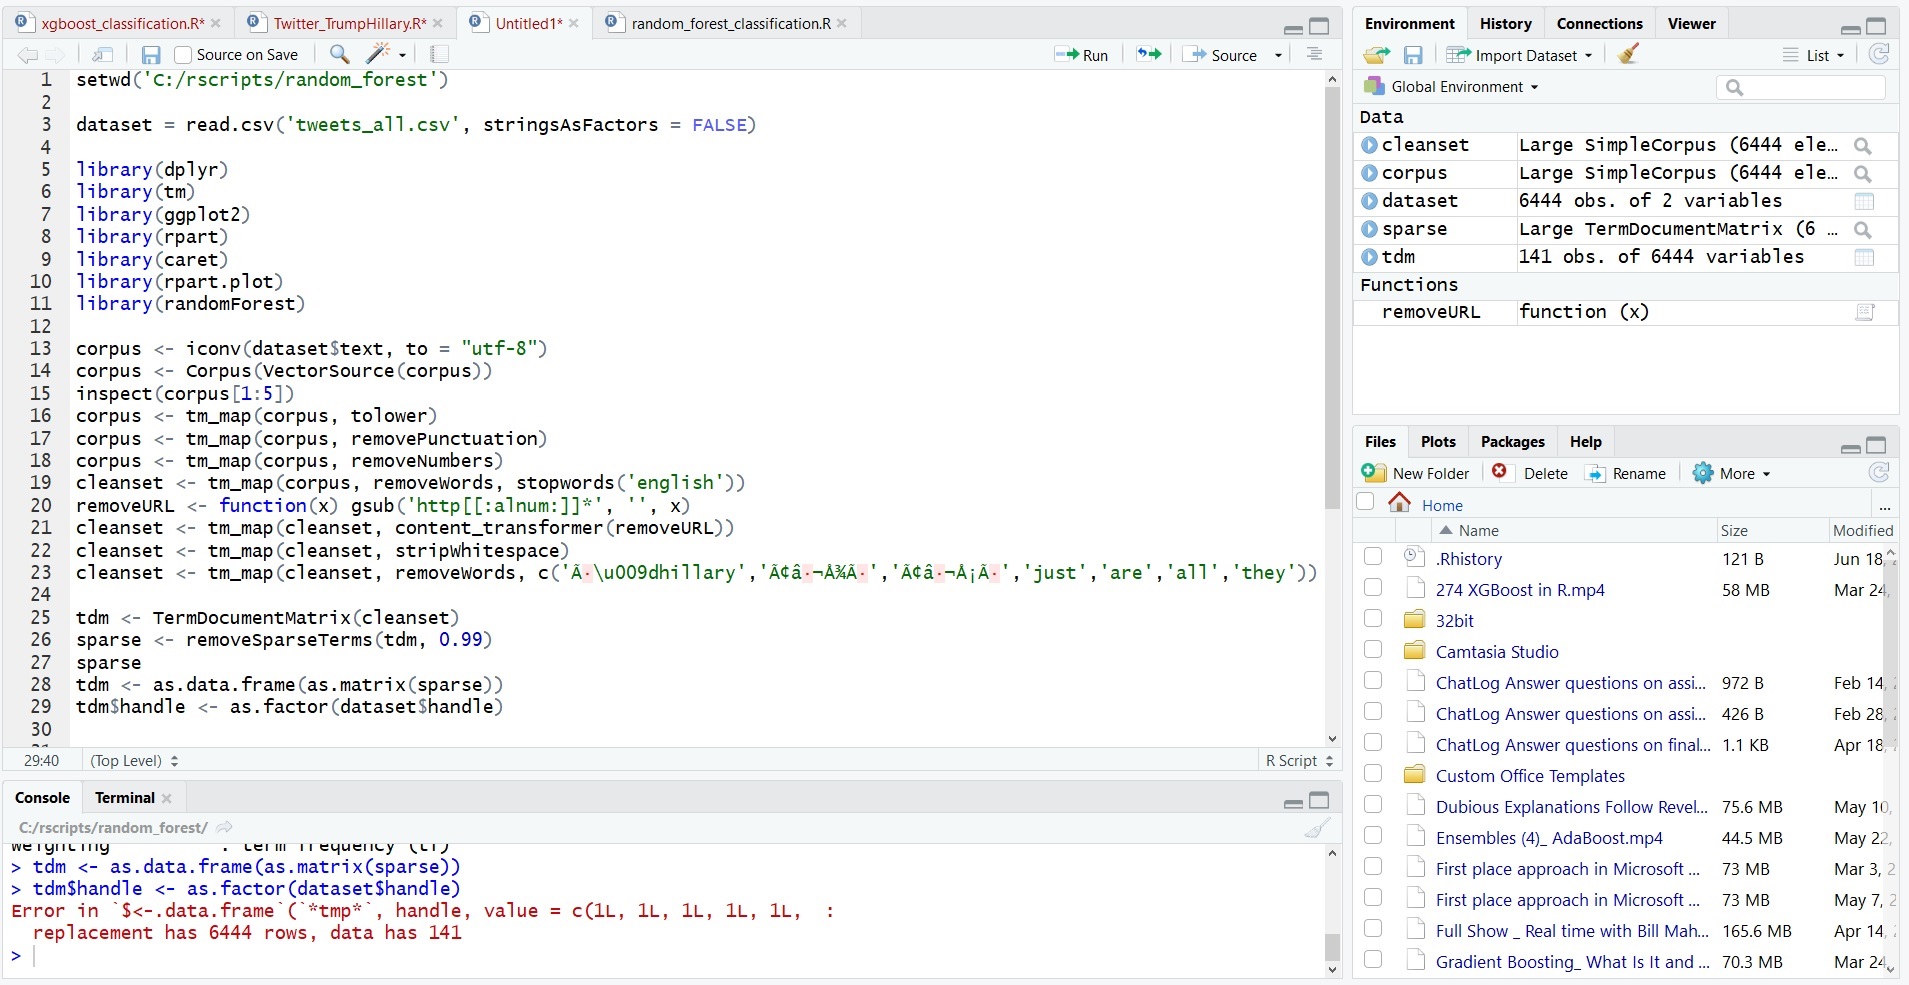
In a nutshell, I need to be able to run a document term matrix from a Twitter dataset within an XGBoost classifier. I have completed the document term matrix, but I am missing some key part of preparing the DTM and putting it in a format that the model will accept. I know that you have to convert the DYM back to a data frame, and then you have to create the "training" and "testing" partitions. Can someone put me on the right track as far as the code that I am missing?

Here is the code for the Natural Language Processing part:

setwd('C:/rscripts/random_forest')

dataset = read.csv('tweets_all.csv', stringsAsFactors = FALSE)

library(tm)

corpus <- iconv(dataset$text, to = "utf-8")
corpus <- Corpus(VectorSource(corpus))
inspect(corpus[1:5])
corpus <- tm_map(corpus, tolower)
corpus <- tm_map(corpus, removePunctuation)
corpus <- tm_map(corpus, removeNumbers)
cleanset <- tm_map(corpus, removeWords, stopwords('english'))
#my_custom_stopwords <- c("â€\u009dpotus", "Â\u009dÃ", "Â\u009djoebiden", "Â\u009dand", "Â\u009dhillary", "„Â") 
#cleanset <- tm_map(corpus, removeWords, my_custom_stopwords)                         
removeURL <- function(x) gsub('http[[:alnum:]]*', '', x)
cleanset <- tm_map(cleanset, content_transformer(removeURL))
cleanset <- tm_map(cleanset, stripWhitespace)
cleanset <- tm_map(cleanset, removeWords, c('Â\u009dhillary','„Â','‚Â','just','are','all','they'))

tdm <- TermDocumentMatrix(cleanset)
tdm <- as.matrix(tdm)

Here is the code that I found to use for the XGBoost classification model. It is currently written to accommodate a different dataset (i.e. mushroom data), but I was going to recycle this code to use with my document term matrix from my text mining.

library(caret)
library(xgboost)
install.packages('e1071', dependencies=TRUE)

mushroom_data$cap.shape  = as.factor(mushroom_data$cap.shape)

newvars    <- dummyVars(  ~ cap.shape + cap.surface + cap.color + bruises + odor + gill.attachment + gill.spacing +
				    gill.size + gill.color  + stalk.shape + stalk.root + stalk.surface.above.ring + 
					stalk.surface.below.ring + stalk.color.above.ring  + stalk.color.below.ring+ 
					veil.color + ring.number + ring.type + spore.print.color+ population+
					habitat ,data=mushroom_data)
newvars    <- predict(newvars, mushroom_data)

cv.ctrl <- trainControl(method = "repeatedcv", repeats = 1,number = 4,allowParallel=T)
xgb.grid <- expand.grid(nrounds = 40,eta = c(0.5,1),max_depth = c(7,10),gamma = c(0,0.2),colsample_bytree=c(1),min_child_weight=c(0.1,0.9))

xgb_tune <-train( newvars , mushroom_data$class,
                     method="xgbTree",
                     trControl=cv.ctrl,
                     tuneGrid=xgb.grid
)

pred = predict(xgb_tune,newvars)

mushroom_data$labels[mushroom_data$class=="e"] = 1
mushroom_data$labels[mushroom_data$class=="p"] = 0

mtrain  <- xgb.DMatrix(data = newvars  , label = as.matrix(mushroom_data$labels))
result_model <- xgboost(data = mtrain ,max_depth = 7, eta = 1, nthread = 4, nrounds = 40, objective = "reg:logistic", verbose = 1)

pred        <- predict(result_model, mtrain)
pred[pred<0.5] = 0
pred[pred>0.5] = 1
joined       = data.frame(mushroom_data$labels,pred)
joined_diff  = joined$mushroom_data.labels- joined$pred
sum(joined_diff)

Can someone please show me how to place my DTM appropriately into the XGBoost code? I can provide the dataset as well.

Hi! Welcome to RStudio Community!

It looks like your code was not formatted correctly to make it easy to read for people trying to help you. Formatting code allows for people to more easily identify where issues may be occuring, and makes it easier to read, in general. I have edited you post to format the code properly.

In the future please put code that is inline (such as a function name, like mutate or filter) inside of backticks (`mutate`) and chunks of code (including error messages and code copied from the console) can be put between sets of three backticks:

```
example <- foo %>%
  filter(a == 1)
```

This process can be done automatically by highlighting your code, either inline or in a chunk, and clicking the </> button on the toolbar of the reply window!

This will help keep our community tidy and help you get the help you are looking for!

For more information, please take a look at the community's FAQ on formating code

In addition, you are much more likely to get help if you post a REPRoducible EXample (reprex). Currently, you are using data that is only available on your local system so people will not be able to replicate your problem.

I was using a tutorial that I found online to figure out how to feed my DTM to a machine learning model, in this case it was randomForest. Everything worked up until the last line where I got an error. I included a screen capture to demonstrate what the problem is. Can someone tell me what it is that I am not doing correctly?

Just for clarification, the program errors when the following line of code is run:

tdm$handle <- as.factor(dataset$handle)

That line of code tries to replace the values in the handle column of the tdm data frame with the values from the handle column of the dataset data frame, after converting dataset$handle into a factor. The problem is, dataset is 6444 rows long, while tdm is only 141 rows long (you can actually see this in your Environment pane — "obs." = observations = rows). R has no idea how to squish 6444 values into a space that can only hold 141 values, so you get the error message that says "replacement has 6444 rows, data has 141".

What were you trying to accomplish with that line of code?

A tiny, friendly tip: screenshots are a fairly unfriendly way to show what your problem is, unless your problem is something explicitly graphical. In this case, the best thing to do would have been to paste in your code (formatted as code :sparkles: :slight_smile:) and also paste in the error message (it usually helps to format these as code too, since they are often written assuming they will be displayed with a fixed-width font).

Thank you for the reply. I was following along with a tutorial. It got to this part and it did not explain that there was an additional step or two needed to process the DTM before the line of code that I posted.

setwd('C:/rscripts/random_forest')

dataset = read.csv('tweets_all.csv', stringsAsFactors = FALSE)

library(tm)

corpus <- iconv(dataset$text, to = "utf-8")
corpus <- Corpus(VectorSource(corpus))
inspect(corpus[1:5])
corpus <- tm_map(corpus, tolower)
corpus <- tm_map(corpus, removePunctuation)
corpus <- tm_map(corpus, removeNumbers)
cleanset <- tm_map(corpus, removeWords, stopwords('english'))
removeURL <- function(x) gsub('http[[:alnum:]]*', '', x)
cleanset <- tm_map(cleanset, content_transformer(removeURL))
cleanset <- tm_map(cleanset, stripWhitespace)
cleanset <- tm_map(cleanset, removeWords, c('Â\u009dhillary','„Â','‚Â','just','are','all','they'))

tdm <- TermDocumentMatrix(cleanset)
tdm
tdm <- as.matrix(tdm)

Here is my code, minus the one line which caused the error. Sorry for the ignorance of how some of this works. I am still learning and appreciate the assistance.

If you link to the tutorial you're following, it will make it easier for people to help with questions about it!

But I'm also a little confused — do you still have a question related to the random forest tutorial? And if so, is that a separate issue from the original topic (which was how to make your data work with xgboost)?

I apologize for being confusing. The tutorial I was using was a udemy course that I paid for that covered text mining and machine learning with R. I was able to successfully take a dataset of tweets, clean them, and then put them into a document term matrix. After the DTM was created, the tutorial used randdomForest to process the document term matrix. I was following the tutorial to see how to do it. I need to do the same thing except place the newly created DTM into an XGBoost model. After I created the DTM, the instructions said that I had to convert it to a data vector so it would be in a format that the model would accept. This is when I wrote the line of code:

tdm$handle <- as.factor(dataset$handle)

This was supposed to have the target label on the vector. When I ran it, I got the error that you saw which stated that the size of the columns were not matched that you pointed out to me. There was a step that the tutorial did not cover where I am supposed to adjust the columns in my vector so that the randomForest model will accept it and run.

Sorry I do not have everything in the right format and I don't have a public facing tutorial that I can directly link to. I guess that the one thing that I needed assistance with was what you pointed out earlier, which was making sure that the converted DTM had the correct columns.
Sorry, I am a noob.

Ah, ok, I think I understand how all the parts connect now! Thanks for the explanation. And I think my last post sounded more chiding than I intended, so I apologize for that! There’s nothing wrong with being new — we were all new once.

I don’t know what package you were using for the random forest approach, but it might be helpful to know that since different packages are developed by different people, the specific steps to fit one model aren’t always the same as those to fit another model using tools from a different package. The concepts transfer, but sometimes the specific code may not really transfer, and you have to learn a different way of achieving a similar result. This can be pretty confusing when it’s all new!

So definitely keep asking questions! When people like me nudge you to pose your question in a certain way or provide specific info, it’s because that legitimately makes it easier for helpers to answer your questions, which hopefully gets you what you need faster and more successfully.

Thank you for your encouragement. I actually found another good tutorial online for using XGBoost with text features. Here is the link:

I used a movie review dataset with this tutorial. I had one question I wanted to see if you could answer. At the end of the R script, xgb.plot creates a bar chart. It is enormous because of all of the words in the feature set. Could you tell me how I might reduce the size of the bar chart by half or more? Here is my code. You can refer to the original tutorial.

library(text2vec)
library(xgboost)
library(pdp)

setwd('C:/rscripts/movies')

imdb = read.csv('movies.csv', stringsAsFactors = FALSE)

# Create the document term matrix (bag of words) using the movie_review data frame provided
# in the text2vec package (sentiment analysis problem)
#data("movie_review")

# Tokenize the movie reviews and create a vocabulary of tokens including document counts
vocab <- create_vocabulary(itoken(imdb$text,
                                  preprocessor = tolower,
                                  tokenizer = word_tokenizer))

# Build a document-term matrix using the tokenized review text. This returns a dgCMatrix object
dtm_train <- create_dtm(itoken(imdb$text,
                               preprocessor = tolower,
                               tokenizer = word_tokenizer),
                        vocab_vectorizer(vocab))

# Turn the DTM into an XGB matrix using the sentiment labels that are to be learned
train_matrix <- xgb.DMatrix(dtm_train, label = imdb$class)

# xgboost model building
xgb_params = list(
  objective = "binary:logistic",
  eta = 0.01,
  max.depth = 5,
  eval_metric = "auc")

xgb_fit <- xgboost(data = train_matrix, params = xgb_params, nrounds = 100)

# Check the feature importance
importance_vars <- xgb.importance(model=xgb_fit, feature_names = colnames(train_matrix))
head(importance_vars, 20)

# Try to plot a partial dependency plot of one of the features
partial(xgb_fit, train = imdb, pred.var = "bad")

xgb.plot.importance(importance_matrix = importance_vars)

Thank you for helping a noob in trying to navigate R.

Glad you found an example that helped!

The general answer is that you'd want to filter the data set before or during plotting, to pare it down to the values of greatest interest. But in this case, the package author has anticipated that you might want to do this and built a parameter called top_n into xgb.plot.importance() that allows you to specify how many features you want to plot. I figured that out by checking the xgb.plot.importance() documentation — do you know that you can find the docs for any function by typing ?function_name in the console? (so here: ?xgb.plot.importance)

Here's a reprex based on the movie_review data showing a few different ways of choosing how many features to include in your plot:

Start off by fitting the model and calculating importance measures. This part is the same as in the example you found...
library(text2vec)
library(xgboost)

data("movie_review")

vocab <- create_vocabulary(itoken(movie_review$review,
                                  preprocessor = tolower,
                                  tokenizer = word_tokenizer))

dtm_train <- create_dtm(itoken(movie_review$review,
                               preprocessor = tolower,
                               tokenizer = word_tokenizer),
                        vocab_vectorizer(vocab))

train_matrix <- xgb.DMatrix(dtm_train, label = movie_review$sentiment)

xgb_params <- list(
  objective = "binary:logistic",
  eta = 0.01,
  max.depth = 5,
  eval_metric = "auc")

xgb_fit <- xgboost(data = train_matrix, params = xgb_params, nrounds = 20)

# Calculate feature importance
importance_vars <- xgb.importance(model = xgb_fit, feature_names = colnames(train_matrix))
# Arbitrarily plot top 20 most important features
xgb.plot.importance(importance_vars, top_n = 20)

# Plot all features with raw importance measure above 0.05
xgb.plot.importance(importance_vars, top_n = sum(importance_vars$Gain >= 0.05))

# Plot most important features that cumulatively account for 85% of importance
xgb.plot.importance(importance_vars, top_n = sum(cumsum(importance_vars$Gain) <= 0.85))

Notes:

  • importance_vars contains more than one importance measure. When calculating top_n based on the value of that measure, you obviously want to make sure you're using the same measure as xgb.plot.importance() is plotting. The documentation explains which measure gets plotted by default for which type of model (in this case, Gain is being plotted so I based my top_n calculations on that metric).
  • In the third plot, I'm taking advantage of the fact that the Gain measure is already normalized so that all the values add up to 1.

  • In both the second and third plot, I'm taking the sum of a logical vector in order to calculate the number of features that pass a test. This works because because a logical TRUE is converted to 1 (and FALSE to 0) when used in a numerical calculation. To break down the third plot calculation a little bit more:

# cumsum() calculates the cumulative sum of every element in importance_vars$Gain
cumsum(importance_vars$Gain)
#>  [1] 0.3308355 0.5171715 0.6265316 0.7130263 0.7831457 0.8306521 0.8685940
#>  [8] 0.8802707 0.8899960 0.8992508 0.9078467 0.9145571 0.9208164 0.9270314
#> [15] 0.9326268 0.9380329 0.9428687 0.9467621 0.9502315 0.9535286 0.9566786
#> [22] 0.9597786 0.9628695 0.9659197 0.9688592 0.9716898 0.9744443 0.9763916
#> [29] 0.9782210 0.9799569 0.9814198 0.9828529 0.9841932 0.9853792 0.9864692
#> [36] 0.9875366 0.9885779 0.9895849 0.9905857 0.9914649 0.9922618 0.9930066
#> [43] 0.9936814 0.9943547 0.9949693 0.9955805 0.9961856 0.9967846 0.9973159
#> [50] 0.9978439 0.9983661 0.9987993 0.9991188 0.9993273 0.9995294 0.9996510
#> [57] 0.9997554 0.9998372 0.9998786 0.9999196 0.9999603 1.0000000

# Applying a logical comparison to each element in the vector of cumulative sums 
# gives a vector of logical values representing the result of each comparison
cumsum(importance_vars$Gain) <= 0.85
#>  [1]  TRUE  TRUE  TRUE  TRUE  TRUE  TRUE FALSE FALSE FALSE FALSE FALSE
#> [12] FALSE FALSE FALSE FALSE FALSE FALSE FALSE FALSE FALSE FALSE FALSE
#> [23] FALSE FALSE FALSE FALSE FALSE FALSE FALSE FALSE FALSE FALSE FALSE
#> [34] FALSE FALSE FALSE FALSE FALSE FALSE FALSE FALSE FALSE FALSE FALSE
#> [45] FALSE FALSE FALSE FALSE FALSE FALSE FALSE FALSE FALSE FALSE FALSE
#> [56] FALSE FALSE FALSE FALSE FALSE FALSE FALSE

# summing that vector of logical values gives the total number of TRUEs
sum(cumsum(importance_vars$Gain) <= 0.85)
#> [1] 6

One more note!

  • Normally you'd want to sort your vector in increasing or decreasing order before applying cumsum() (otherwise the results don't make much sense!). In this case, xgb.importance() happens to have generated the importance_vars data frame in such a way that Gain is already sorted in decreasing order. If I wanted to calculate the cumulative sum of the other measure, Cover, I'd need to sort it first — right now it's following the sort order of Gain. That would look like:
cumsum(sort(importance_vars$Cover, decreasing = TRUE))

Thank you very much for your very verbose assistance! Since I went into my PhD program I have had to make peace with learning how to use machine learning and AI. I have gotten comfortable with R for doing text mining and sentiment analysis using some of the built-in packages, but I am starting to get an understanding of how to use some of the models that I need to be familiar with. I will definitely keep this forum in my bookmarks list. Thanks again.

I had one more question for you. I was trying to get some performance metrics for this model. I have the code, but I am not able to place the parameters in this code correctly. I used the ?importance to try to get this to work, but I keep getting the following error:

Error: `data` and `reference` should be factors with the same levels.

Here is the R code in its entirety:

library(text2vec)
library(xgboost)
library(pdp)

setwd('C:/rscripts/movies')

imdb = read.csv('movies.csv', stringsAsFactors = FALSE)

# Create the document term matrix (bag of words) using the movie_review data frame provided
# in the text2vec package (sentiment analysis problem)
#data("movie_review")

# Tokenize the movie reviews and create a vocabulary of tokens including document counts
vocab <- create_vocabulary(itoken(imdb$text,
                                  preprocessor = tolower,
                                  tokenizer = word_tokenizer))

# Build a document-term matrix using the tokenized review text. This returns a dgCMatrix object
dtm_train <- create_dtm(itoken(imdb$text,
                               preprocessor = tolower,
                               tokenizer = word_tokenizer),
                        vocab_vectorizer(vocab))

# Turn the DTM into an XGB matrix using the sentiment labels that are to be learned
train_matrix <- xgb.DMatrix(dtm_train, label = imdb$class)

# xgboost model building
xgb_params = list(
  objective = "binary:logistic",
  eta = 0.01,
  max.depth = 5,
  eval_metric = "auc")

xgb_fit <- xgboost(data = train_matrix, params = xgb_params, nrounds = 10)

set.seed(1)
cv <- xgb.cv(data = train_matrix, label = imdb$class, nfold = 5,
             nrounds = 60)

library(caret)
library(Matrix)

# Create our prediction probabilities
pred <- predict(xgb_fit, dtm_train)

# Set our cutoff threshold
pred.resp <- ifelse(pred >= 0.86, 1, 0)

# Create the confusion matrix
confusionMatrix(pred.resp,xgb.cv, positive="1")

From looking at a number of discussion forums online I could see that for the "Prediction" function, I am supposed to pass an object and the "test" partition object. I tried placing several of the variables from my code into this line and I could not get it to work.

Again, sorry for the noob questions. I have been doing this for the most part in RapidMiner previously where the coding was done for you. I am learning, and I appreciate all of the assistance from this group.

So if I'm understanding correctly, the function you're having trouble with now is caret::confusionMatrix? Did you take a look at ?confusionMatrix? The documentation explains what the function needs for the data and reference parameters: two factor vectors with the exact same levels, one of which is the predicted classifications for your data, and the other is the known true classifications. (Alternatively, you can give it the results of tabulating your predicteds vs reference yourself, which would be a table created with the table() function) You can also read more about confusionMatrix at the caret documentation site.

Does that get you any further? You may need to convert some of the objects you have into factor vectors (being careful to keep control of the levels) before you can use them in confusionMatrix. I'm afraid I can't give more specific advice right now since I don't have your data, so I can't easily run your code. Is the movie data you were using available online?

Also... you seem to still be struggling with getting your code formatted nicely in your posts. It looks like you're setting off the code with lots of apostrophes(''''''''''''''''''''), whereas you need to be using three backticks (```). Or, just select your code and click the </> button at the top of the posting box, which will insert the proper formatting for you! :grinning: