Here is a version that stores all the results in one data frame. You can split that data frame into three by filtering on Column, if you want to.
library(tidyr)
library(dplyr)
 c1<-c(16.6,1.0,10.1,8.6,8.0,17.0,2.4,7.6,5.7,11.6,3.6,2.8,6.3,1.5,2.7,16.7,6.7,5.3,12.5)
 c2<-c(13.0,11.2,11.0,15.0,10.0,11.5,9.6,7.8,9.2,6.6,1.6,8.2,18.0,18.9,NA,NA,2.9,16.1,17.8)
 c3<-c(4.2,5.6,1.4,3.4,5.0,5.8,5.1,8.2,8.8,9.1,1.9,7.7,9.1,10.6,3.7,9.9,10.2,11.5,NA)
 c4<-c(1:19)
 c5<-data.frame(c4,c1,c2,c3)
 colnames(c5)<-c("id","col1","col2","col3")
c5 <- c5 |> pivot_longer(cols = col1:col3,
names_to = "Column", values_to = "Value") |>
mutate(Group=cut(Value,breaks = seq(1,19,3),right = FALSE))
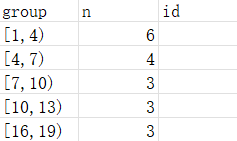
GrpCount <- count(c5,Column, Group) |>
na.omit()
MaxIDCnt <- max(GrpCount$n)
ColNames <- paste("Grp",1:MaxIDCnt,sep = "_")
Labeled <- inner_join(GrpCount,c5,by=c("Column", "Group")) |>
group_by(Column, Group, n) |>
summarize(Label=paste(id,collapse = ","))
#> `summarise()` has grouped output by 'Column', 'Group'. You can override using
#> the `.groups` argument.
Labeled <- Labeled |> separate(Label,into = ColNames,fill = "right")
head(Labeled,10)
#> # A tibble: 10 × 9
#> # Groups: Column, Group [10]
#> Column Group n Grp_1 Grp_2 Grp_3 Grp_4 Grp_5 Grp_6
#> <chr> <fct> <int> <chr> <chr> <chr> <chr> <chr> <chr>
#> 1 col1 [1,4) 6 2 7 11 12 14 15
#> 2 col1 [4,7) 4 9 13 17 18 <NA> <NA>
#> 3 col1 [7,10) 3 4 5 8 <NA> <NA> <NA>
#> 4 col1 [10,13) 3 3 10 19 <NA> <NA> <NA>
#> 5 col1 [16,19) 3 1 6 16 <NA> <NA> <NA>
#> 6 col2 [1,4) 2 11 17 <NA> <NA> <NA> <NA>
#> 7 col2 [4,7) 1 10 <NA> <NA> <NA> <NA> <NA>
#> 8 col2 [7,10) 4 7 8 9 12 <NA> <NA>
#> 9 col2 [10,13) 4 2 3 5 6 <NA> <NA>
#> 10 col2 [13,16) 2 1 4 <NA> <NA> <NA> <NA>
Created on 2022-10-30 with reprex v2.0.2