Hello: I am trying to display frequency distributions with both values and value labels, as in the example below (similar to what you get with STATA or SPSS) (See Figure A below)
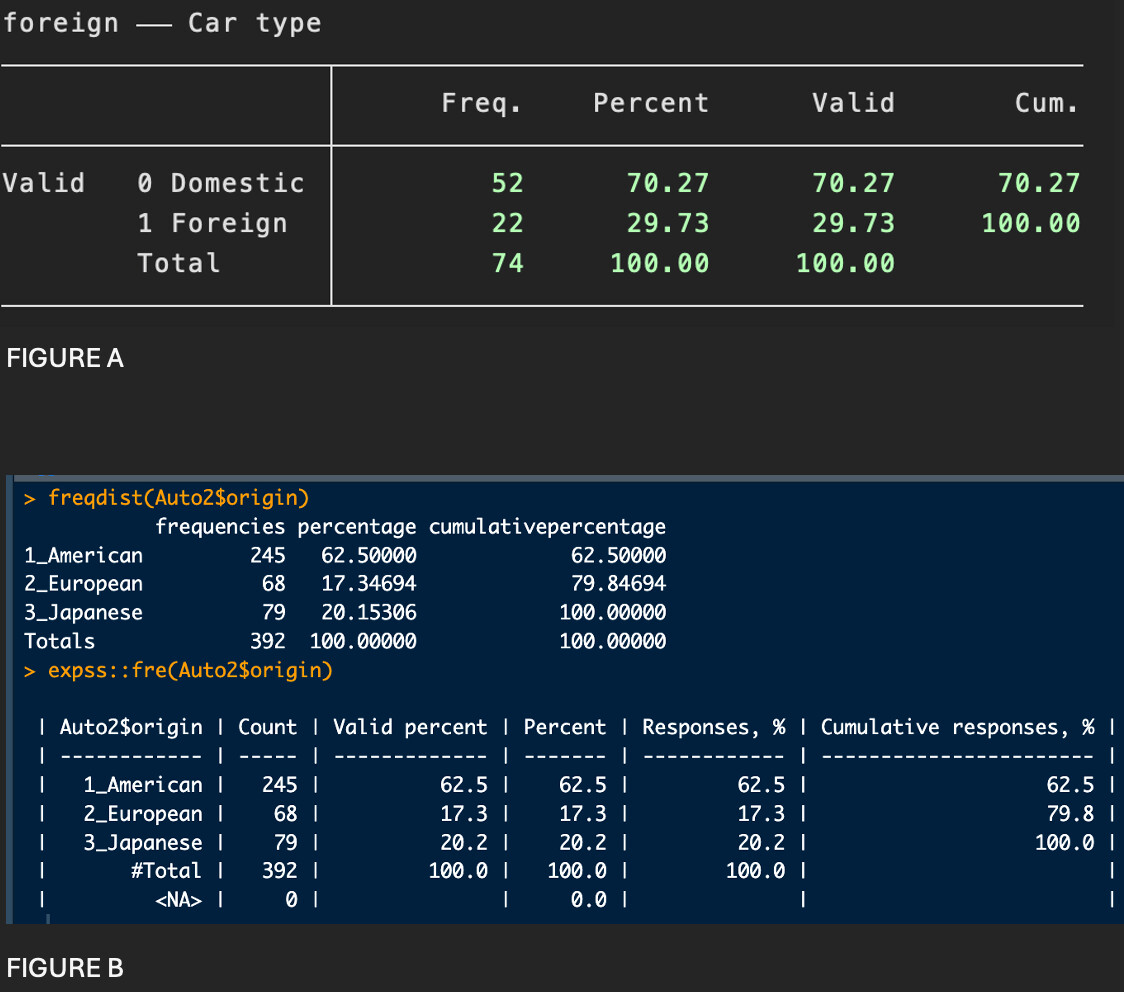
However, my attempts at doing these have not been successful. The code below produces the results in Figure B. These two commands were only able to get the value labels, but not the accompanying values:
Auto2 <- within(Auto, {
  origin <- factor(origin, labels = c("1_American", "2_European", "3_Japanese"))
})

freqdist(Auto2$origin)
expss::fre(Auto2$origin)
Please, let me know of any tips, strategies to work around this limitation in R.
/CY