I've been plotting one continuous variable as a function of another without difficulty for a project -- until now. I expect
scale_x_continuous(breaks = seq(1, 13, 1))
to produce an x-axis ranging from 1 to 13 with labeled tic marks at each integer position. Instead, I get
Error:
! Discrete value supplied to continuous scale
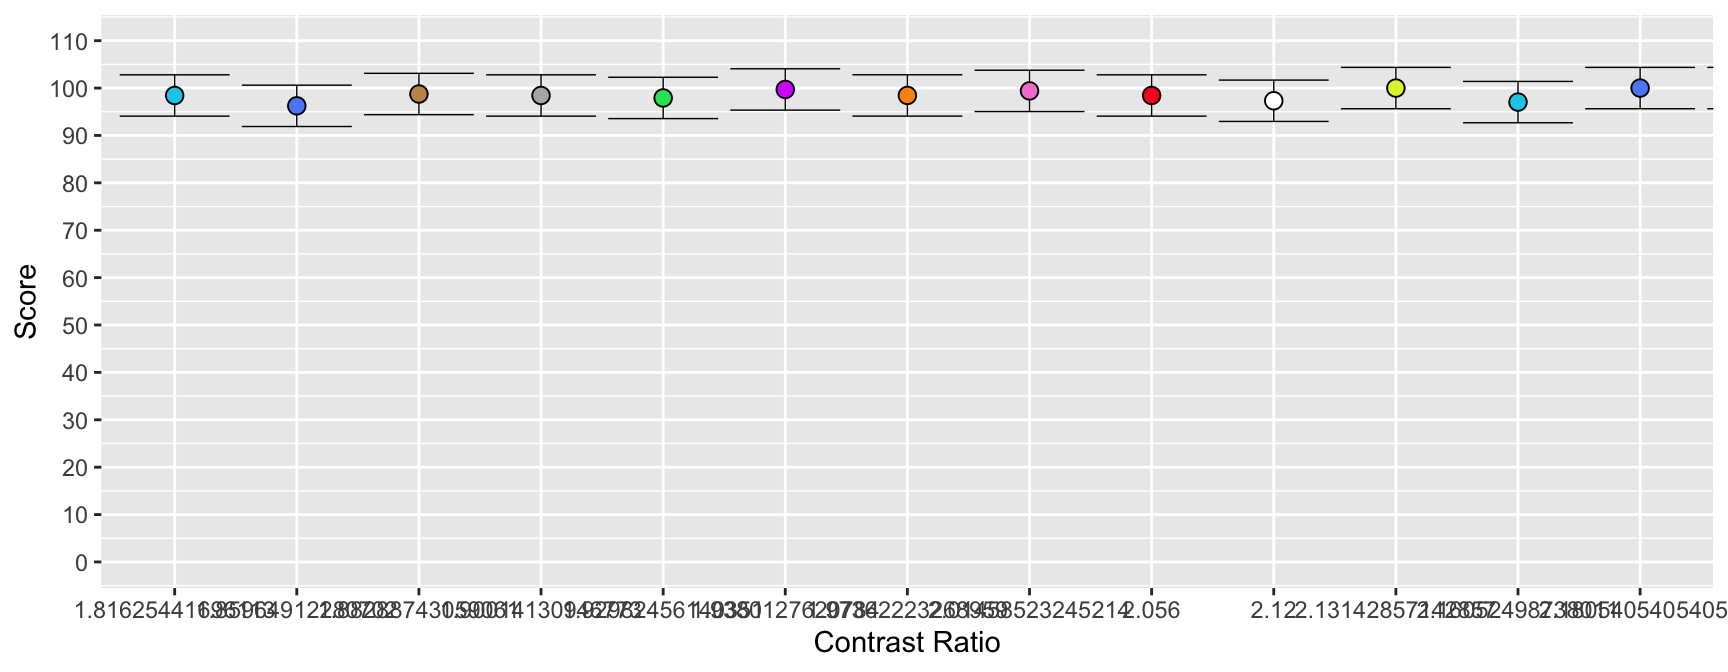
The data frame containing the values I'm plotting was produced by ezStats, and I'm plotting Mean as a function of CR. Its first few entries look like this:
So it appears that ggplot2 thinks CR is a categorical variable. It plots the first 13 (out of 176) entries and tries to label each tic mark with the value of CR for the associated data point.
I' don't understand why this problem occurs only in this case or how to fix it.
It does look like CR is a character or factor. What is the type of the data? Use the function str() on the data frame. My guess is that it is a character so try something like this:
Error in `mutate()`:
ℹ In argument: `CR = parse_number(CR)`.
ℹ In group 1: `SubjectID = 2`, `Backlight = 550`, `TargetColor = "AQUA"`.
Caused by error in `parse_vector()`:
! is.character(x) is not TRUE
so CR doesn't appear to be a string. It's calculated like so: