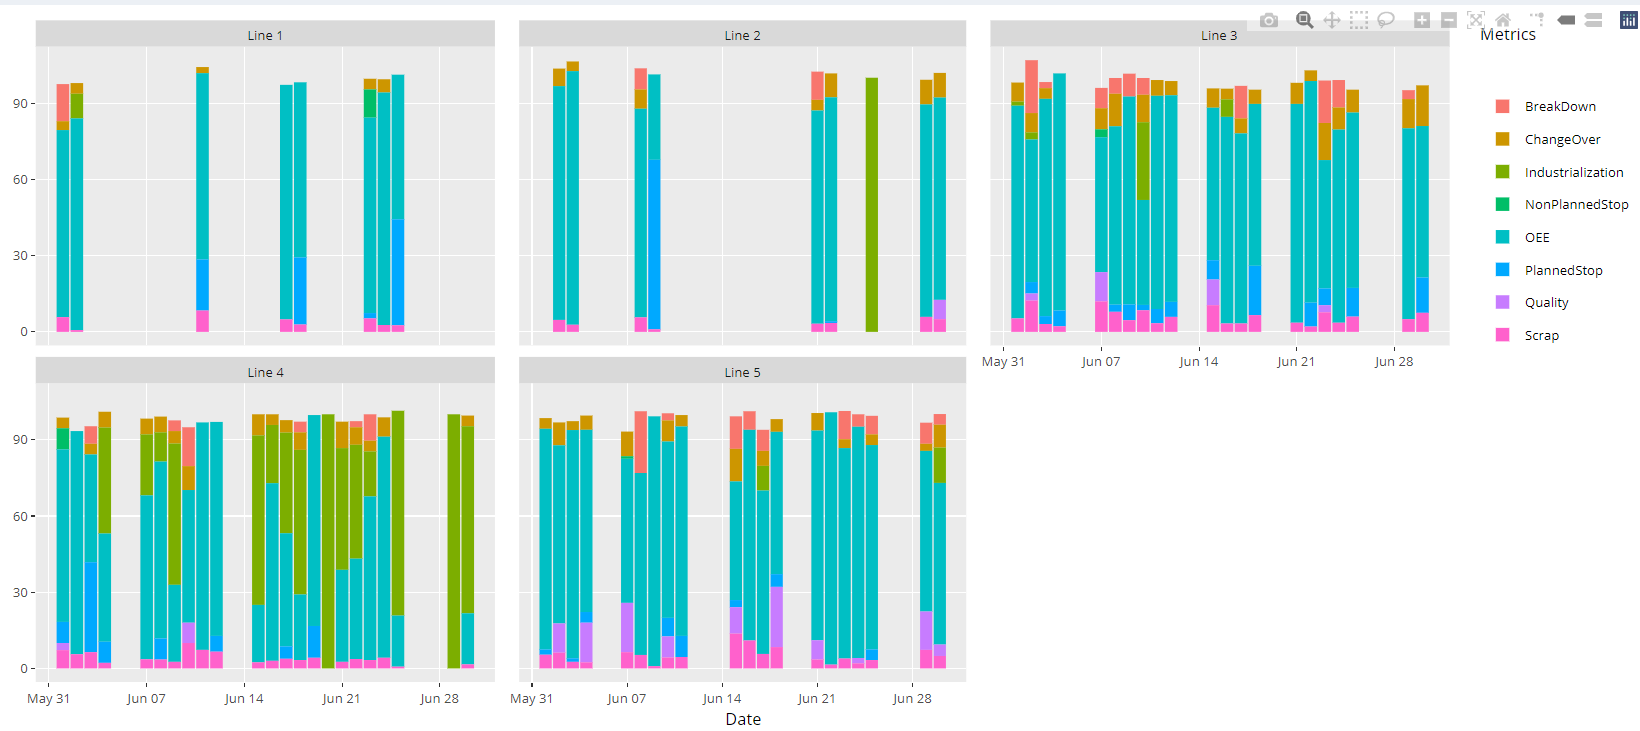
is there a direct way to have the plotly plot below, rather than going through the ggplot?
output$plotly1 <- renderPlotly({
      g <- ggplot(testdata, aes(fill=Metrics, y=Percent, x=Date)) +
        geom_bar(position="stack", stat="identity") +
        facet_wrap(~Line, strip.position = "bottom") +
        ylab("Metric Percentage (%)")

      ggplotly(g)
})
that is, something to start with:
output$plotly1 <- renderPlotly({
                       plot_ly(****)
})
Thanks.
What would be inside that plot_ly?
That depends on what plot you are making.
yes, I visited the link before, but for my example of stacked + facet_wrap, it seems not easy to do it directly inside plot_ly.
Splendid, I will take a look, thanks for much for the link.
I think this is what you are after:
Check out specifically the section titled -subplot()
This post took a while to get approved. This is the same as what nirgrahamuk shared as well.
I try out this link r - How to facet a plot_ly() chart? - Stack Overflow and try to modify to my needs, but seems it is not straight forward, because I have 3 dimensions (Date, Line, Metrics).
testdata %>%
+   group_by(Metrics) %>%
+   group_map(~ plot_ly(data=., x = ~Date, y = ~Percent, color = ~Metrics, type = "bar"), keep=TRUE) %>%
+   subplot(nrows = 1, shareX = TRUE, shareY=TRUE)
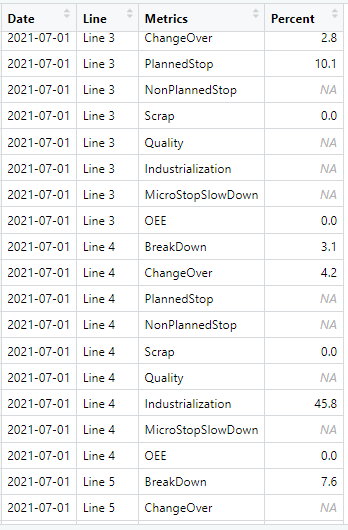
My testdata looks like this:
Hello,
This is very unlikely to happen, and so it reduces the likelihood you will receive the help you desire.as code
A minimal reproducible example consists of the following items:
A minimal dataset, necessary to reproduce the issue
The minimal runnable code necessary to reproduce the issue, which can be run
on the given dataset, and including the necessary information on the used packages.
Let's quickly go over each one of these with examples:
system
July 16, 2021, 12:14am
13
This topic was automatically closed 7 days after the last reply. New replies are no longer allowed.