I wish to sincerely appeal for assistance on R. I am new to R and finds some difficulties in running the data.
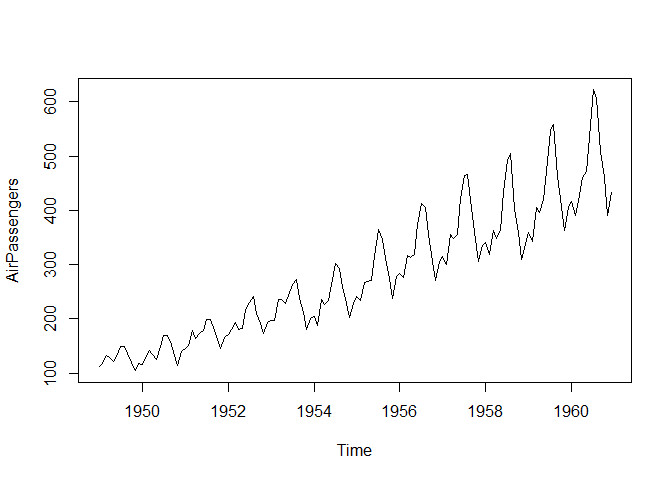
As a beginner, I wanted to use some examples on R for pracrice. So I choose AirPassenger already built in R.
Check the following:
data("AirPassenger ")
AirPassenger
The result is the data I retyped and saved in excel via .CSV comma delimited.
I used this code to import into R.
Billgate <- read.csv(file.choose (), header = T, sep = ",", row.names = 1)
Billgate
kd<- ts(Billgate, start =c(1946), end=(1960), frequency = 1)
kd
the following won't run as shown in the example.
cycle(kd)
summary (kd)
plot (kd)
I even installed
library(ggfortify)
library(tseries)
library (forecast)
Please I need help
UBANI
What are the error messages that you are getting?
To help us help you, could you please prepare a reproducible example (reprex) illustrating your issue? Please have a look at this guide, to see how to create one:
Thank you. I am working with AirPassenger.
The error message:
Error in plotts(x=x, y=y, plot.type=plot.type, xy.labels=xy.labels, : cannot plot more than 10 series as "multiple".
Thanks. I am very much away that AirPassengers is in time series (ts). But I said as a beginner, I decided to type data fresh in excel and save as .CSV then import into R with different name. Then first, I put it as ts and proceed but it never run as yours. So I need the syntax from saving in excel and importing into R, then ts and so on. Thank you Sir for your time.
# checking current contents of the working directory
list.files(path = getwd())
#> [1] "reprex_reprex.R" "reprex_reprex.spin.R"
#> [3] "reprex_reprex.spin.Rmd"
# creating a CSV file containg the AirPassengers dataset
# it will be saved as a single column
write.csv(
x = AirPassengers,
file = "air_passengers_dataset.csv",
row.names = FALSE # the indices for the observations are unnecessary
)
# checking updated contents of the working directory
# the file is indeed created
list.files(path = getwd())
#> [1] "air_passengers_dataset.csv" "reprex_reprex.R"
#> [3] "reprex_reprex.spin.R" "reprex_reprex.spin.Rmd"
# reading the dataset from the CSV file to R
dataset <- read.csv(file = "air_passengers_dataset.csv")
# converting it to time series
dataset_as_time_series <- ts(
data = dataset, # data to be converted to time series
start = c(1949, 1), # 1st month of 1949
end = c(1960, 12), # 12th month of 1960
frequency = 12 # 12 observations per year
)
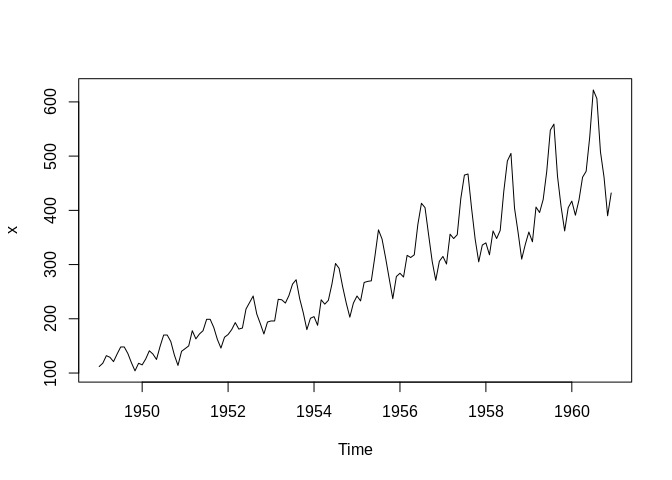
# plotting the time series
plot(x = dataset_as_time_series)
Yes it actually helped. I was able run it but still face the challenge when I used another data "Recife" that was not included in R like "AirPassenger" . I followed the steps as directed but all to no avail. See my entries