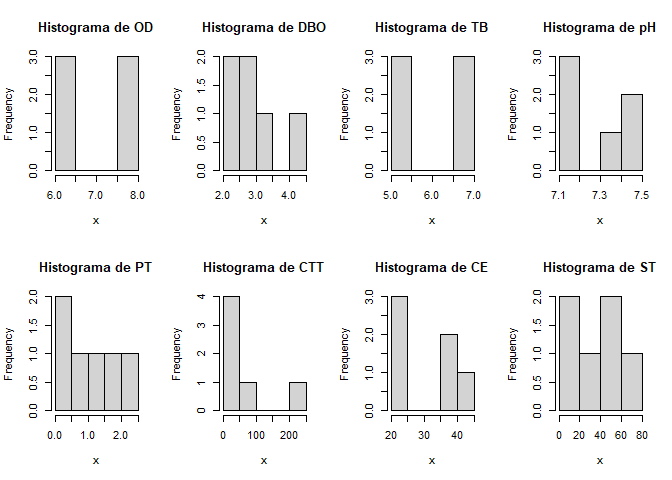
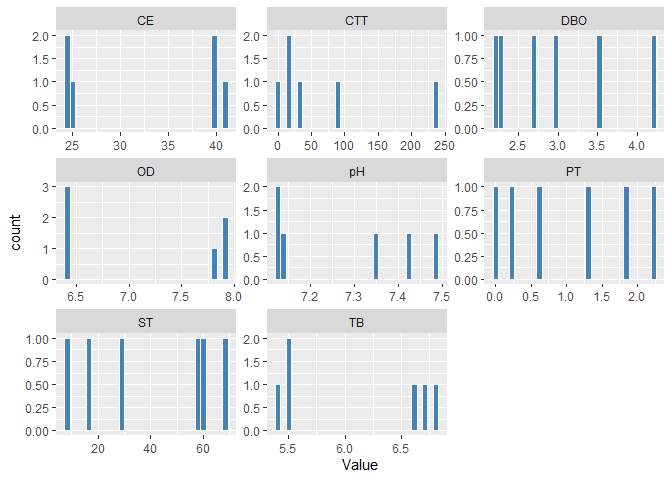
I have a dataset like this;
> head(q_agua)
# A tibble: 6 × 11
  LOCAL DATA                  rep    OD   DBO    TB    pH    PT   CTT    CE    ST
  <chr> <dttm>              <dbl> <dbl> <dbl> <dbl> <dbl> <dbl> <dbl> <dbl> <dbl>
1 P1    2020-02-21 00:00:00     1   6.4   3     6.6  7.48 0.625 240    24.5  8.00
2 P1    2020-02-21 00:00:00     2   6.4   2.3   6.8  7.42 0      36    24.8 16.0
3 P1    2020-02-21 00:00:00     3   6.4   2.7   6.7  7.35 0.224  93    24.7 30.0
4 P1    2020-10-07 00:00:00     1   7.8   2.2   5.5  7.12 1.29    3.5  41.0 60.0
5 P1    2020-10-07 00:00:00     2   7.9   3.5   5.4  7.14 2.23   15    39.6 58.0
6 P1    2020-10-07 00:00:00     3   7.9   4.2   5.5  7.13 1.83   14    39.7 68.0
>
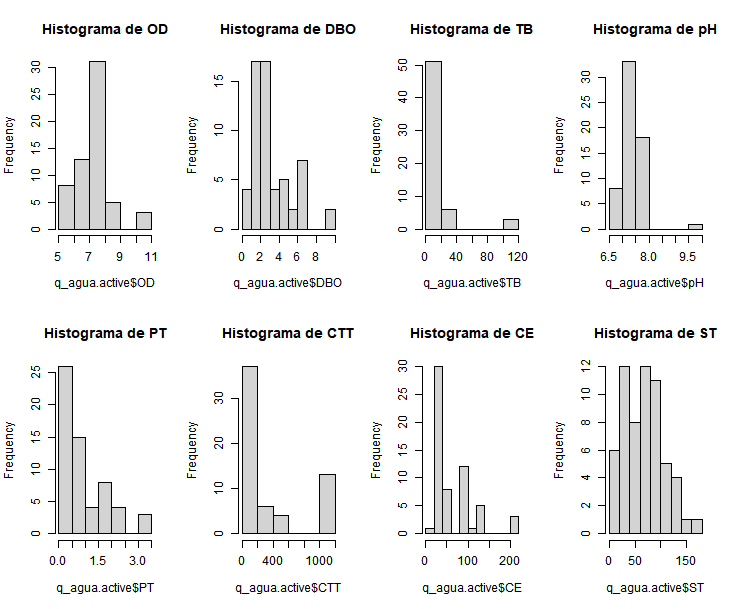
I was able to plot histograms individually with:
library(readxl)

q_agua <- read_xlsx("C:/Users/Nicolas/OneDrive/Documentos/PCA_relatorio_completo.xlsx")

q_agua.active <- q_agua[1:60, 4:11]
 q_agua.active <- na.omit(q_agua.active)

hist(q_agua.active$OD, main = paste("Histograma de OD"))
hist(q_agua.active$DBO, main = paste("Histograma de DBO"))
hist(q_agua.active$TB, main = paste("Histograma de TB"))
hist(q_agua.active$pH, main = paste("Histograma de pH"))
hist(q_agua.active$PT, main = paste("Histograma de PT"))
hist(q_agua.active$CTT, main = paste("Histograma de CTT"))
hist(q_agua.active$CE, main = paste("Histograma de CE"))
hist(q_agua.active$ST, main = paste("Histograma de ST"))
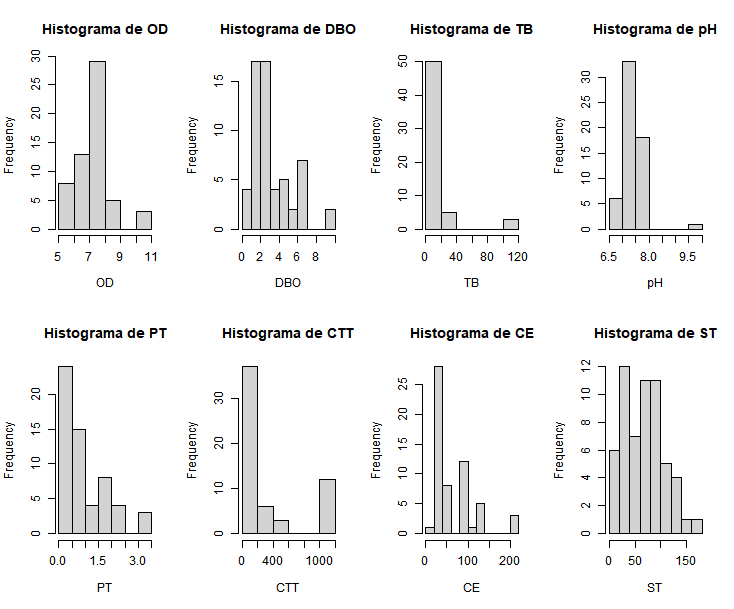
I tried to optimize the script to generate all histograms at once, like this:
par(mfrow = c(2, 4))
loop.vector <- 1:8
for(i in loop.vector) {
  x <- q_agua.active[,i]

  hist(x,
       main = paste("Histograma de", i))
}
And I received the error:
Error in hist.default(x, main = paste("Histograma de", i)) :
  'x' must be numeric
I want to automate the histogram plotting using the column names as the titles.
I'm pretty new to this... Does anybody have any tips? I've been trying to read some, but i'm still stuck.


