Hello,
I am asking for help in terms of fixing a problem on my ggplots; I had never faced this issue before, so I was wondering what it might be.
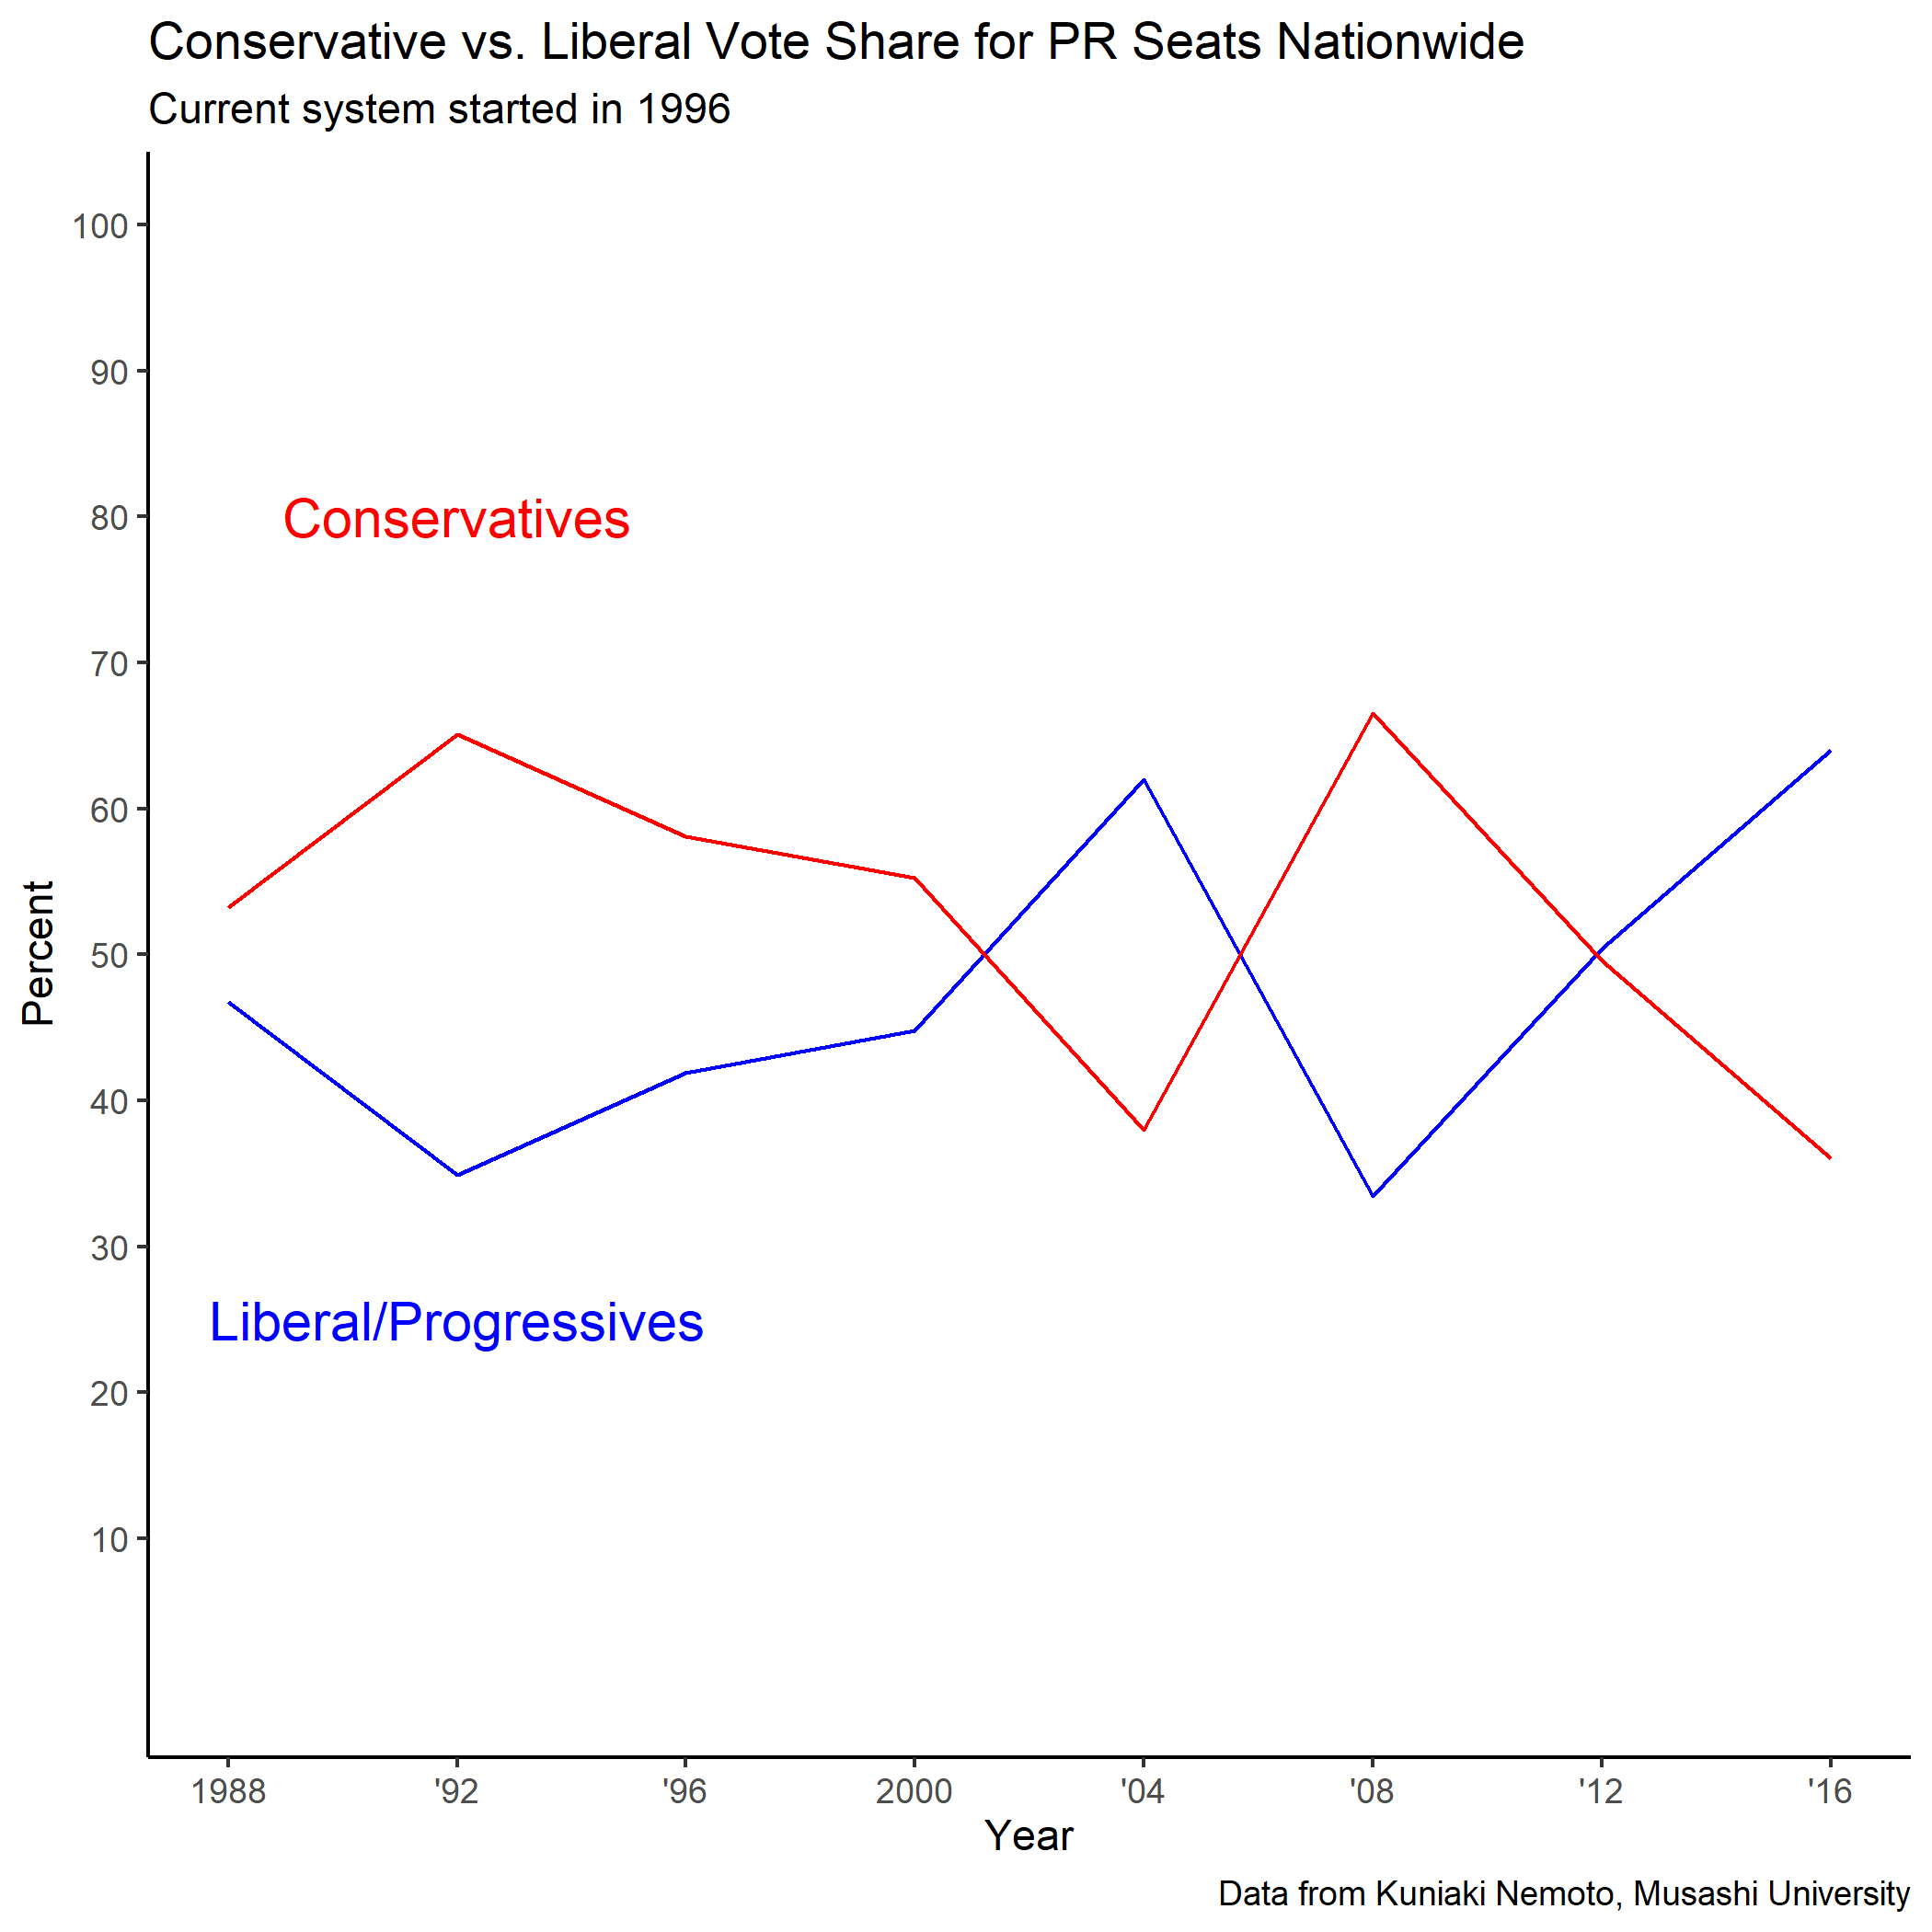
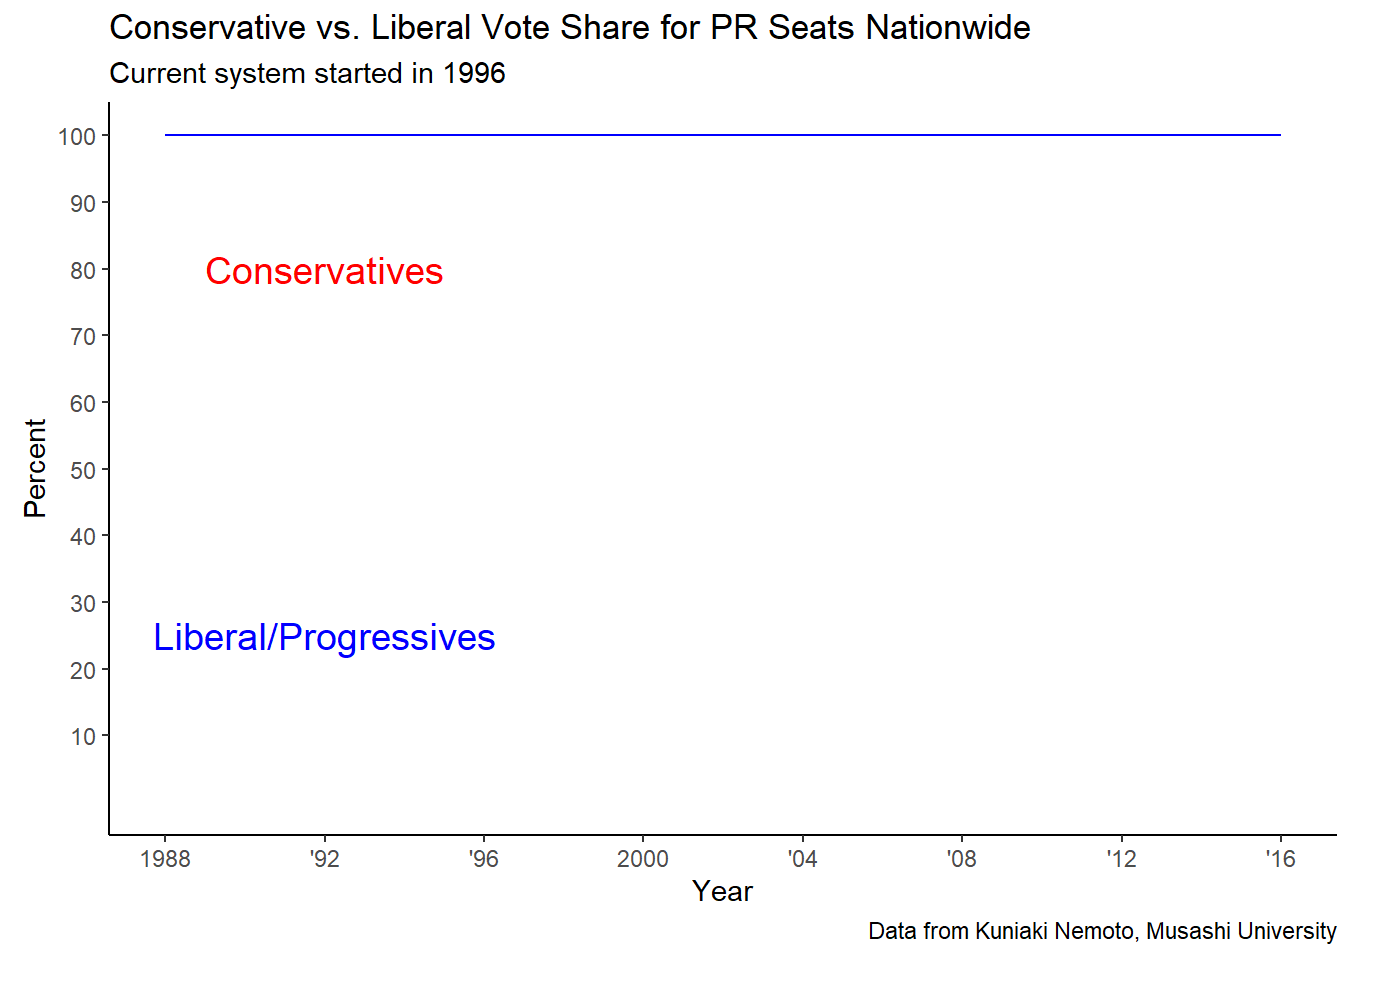
My ggplot on the RMarkdown (this after clearing data output, restarting R, etc. to make sure everything is coherent and works) and the published html version comes out differently.
The following is what I get on my RMD:
This is what I get on my html:
I'm wondering if it has to do something with the actual line itself, but I'm not sure. I am putting the relevant ggplot code down:
``` r

test <- ggplot(PR_twoparty, aes(x=year, y=ideavoteshare,
                                color= factor(cons_or_not))) +

  geom_line() +

  # scale_colour_manual(values = c("blue", "red")) +
  #
  # scale the years
  scale_x_continuous(breaks = seq(1988, 2016, by = 4),
                       labels = c("1988", "'92", "'96", "2000",
                                "'04", "'08", "'12", "'16")) +

  # scale the percentage
  scale_y_continuous(breaks = seq(10, 100, by = 10),
                       limits = c(0, 100)) +

  # add title to graph
  labs(title = "Conservative vs. Liberal Vote Share for PR Seats Nationwide",
         subtitle = "Current system started in 1996",
         caption  = "Data from Kuniaki Nemoto, Musashi University") +

  theme_classic()
#> Error in ggplot(PR_twoparty, aes(x = year, y = ideavoteshare, color = factor(cons_or_not))): could not find function "ggplot"


test
#> Error in eval(expr, envir, enclos): object 'test' not found
Created on 2020-03-06 by the reprex package (v0.3.0)
Thank you for the help!