Hello,
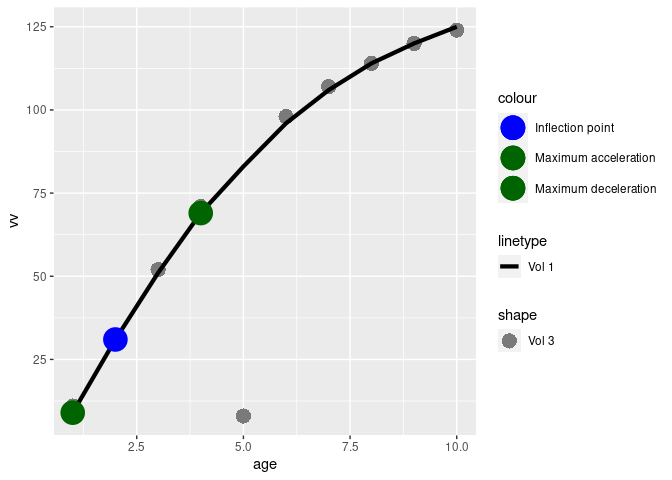
I am trying to add a legend in the graph, but the right colors does not show.
I've tried scale_fill_manual and scale_color_manual, but does not make difference.
Can someone help me please?
Here is the script:
#data
df <- tibble(age = c(1,2,3,4,5,6,7,8,9,10),
            v1 = c(9,31,51,69,83,96,106,114,120,125),
            vv = c(11,31,52,71,8,98,107,114,120,124),
            d1 = c(18,21,19,16,13,10,8,6,4,3),
            d2 = c(7,0.11,-2,-3.29,-3.15,-2.71,-2.20,-1.73,-1.33,-1.02),
            d3 = c(-12,-4.4,-1.4,-0.15,0.34,0.499,0.496,0.43,0.35,0.28),
            d4 = c(12,4.49,1.9,0.78,0.27,0.05,-0.04,-0.074,-0.077,-0.06),
            ima = c(11,15,17.53,17.75,17.24,16.23,15.37,14.34,13.35,12),
            d_ima = c(6.68,2.74, 0.78,-0.23, -0.73, -0.95, -1.03, -1.01, -0.96, -0.89))

# points of the curve
max_ica_pi_c <- filter(df, d1 == max(abs(d1)))[,c('age','vv','v1','d1','d2')]
max_acel_c <- filter(df, d2 == max(abs(d2)))[,c('age','vv','v1','d2','d3')]
max_desacel_c <- filter(df, d2 == min((d2)))[,c('age','vv','v1','d2', 'd3')]
acel_nula_pi_c <- filter(df, d2 == absolute.min(d2))[,c('age','vv','v1','d2')]

ggplot(df,aes(x=age)) +
  geom_point(data = df, aes(y=vv, shape = "Vol 3"), size= 5, color = "grey48") +
  geom_line(data = df, aes(y=v1, linetype = "Vol 1"),size = 1.5, color = "black") +
  geom_point(data = max_ica_pi_c, aes(x =age, y = v1, fill = "Inflection point"), color = "blue", size= 8) +
  geom_point(data = max_acel_c, aes(x =age, y = v1, fill = "Maximum acceleration"), color = "darkgreen", size= 8) +
  geom_point(data = max_desacel_c, aes(x =age, y = v1, fill = "Maximum deceleration"), color = "darkgreen", size= 8)