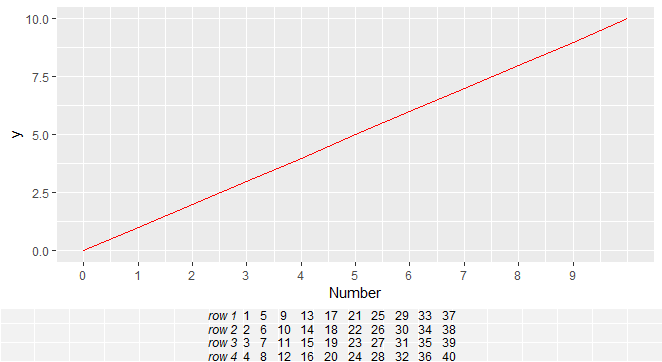
I am plotting together a figure with a text table below it. A simple example is:
library(ggplot2)
library(grid)
library(gridExtra)
df1 <- data.frame(x = 0:10, y = 0:10)
p <- ggplot(df1, aes(x = x, y = y)) + geom_line(col = 'red') +
scale_x_continuous("Number", breaks = 0:9,
limits = c(0, 10))
table1 <- matrix(1:40, nrow = 4)
rownames(table1) <- paste("row", 1:4)
table2 <- tableGrob(table1, rows = rownames(table1),
theme = ttheme_minimal(base_size = 9,
padding = unit(c(0.5, 0.2), 'lines')))
grid.newpage()
b <- arrangeGrob(p, table2,
nrow = 2, heights = unit(c(2, .35),c("null", "null")))
If I now print b, using grid.draw(b), I get a nice table below the figure, with no background:
grid.draw(b)

But if I use plot(b), the table is drawn with a default background:
plot(b)
No trouble for me, of course, since I know to use grid.newpage() to reset the plotting device, then to use grid.draw(b) to get the image. But I suspect that 99.9% of R users will automatically use plot() to render a graphic. Is there a way that I can wrap my returned grob so that "plot()" will display it correctly? Maybe I (or better, the authors of gridExtra) have to create a special instance of plot() to be used to display gtables?
As always, thanks in advance for your help. This is a good site for fast and accurate R help!
Larry Hunsicker