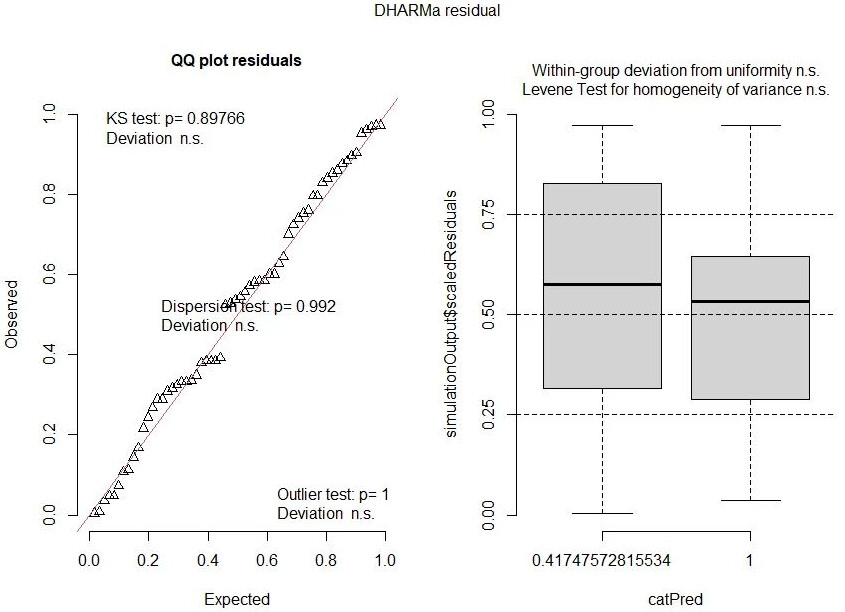
I have performed a linear regression analysis using R and generated some diagnostic plots by using package DHARMa (in R). However, I am having trouble interpreting these plots and would appreciate any guidance on how to read and understand them.
Brief description of my dataset, variables - 60 teachers were asked to indicate their degree of satisfaction in their work, pay, and opportunities for promotion. Regression analysis with dependent variable - work and independent variable as type of school - state (S) or private (P) - was drawn. I would be grateful if someone could provide a brief explanation of each plot and point out any potential issues that might be visible in the plots, as well as possible solutions or next steps to address those issues.
Without a reprex. See the FAQ it's not clear if the dependent variable is continuous, binary or categorical. Interpretation would be different.
The vignette has extensive worked examples
vignette("DHARMa", package="DHARMa")`
that show iterative model development to address misspecification problems. General remarks set the stage for understanding residuals, recognizing over/underdispersion through the plots and using parametric and non-parametric tests, the special case of zero-inflation, heteroscedasticity, detecting missing predictors and incorrect functional assumptions, distance-dependence in the residuals, and the adjustments needed to analyze the cases of Poisson, proportional and binomial data.
While the diagnostics provided are very powerful, they also require clear understanding of the underlying statistical principals.