Hi, I am trying to use dfsummary to create a table of responses to some survey data. The content works fine but when trying to view the output (html) the page is very wide meaning it's difficult to view.
I found reference to col.widths but what ever values I chose, the table is the same.
Code below..
tmp2a<-dfSummary(bsurvey1, plain.ascii = FALSE, style="grid", graph.magnif = 1, valid.col = FALSE, tmp.img.dir = "tmp",col.widths = c(1000,1,1,1,1,1),caption="Survey")
view(tmp2a, file = "\\network\Files\Survey\xls\tmp2a.html")
using 3.6.1.
Any help appreciated.
Thanks
Andrew
Can you provide a reproducible example?
A minimal reproducible example consists of the following items:
A minimal dataset, necessary to reproduce the issue
The minimal runnable code necessary to reproduce the issue, which can be run
on the given dataset, and including the necessary information on the used packages.
Let's quickly go over each one of these with examples:
Hi Williaml, I used the mtcars dataset to show the issue.
Here is the data:
model
mpg
cyl
disp
hp
drat
wt
qsec
vs
am
gear
carb
Mazda RX4
21
6
160
110
3.9
2.62
16.46
0
1
4
4
Mazda RX4 Wag
21
6
160
110
3.9
2.875
17.02
0
1
4
4
Datsun 710
22.8
4
108
93
3.85
2.32
18.61
1
1
4
1
Hornet 4 Drive
21.4
6
258
110
3.08
3.215
19.44
1
0
3
1
Hornet Sportabout
18.7
8
360
175
3.15
3.44
17.02
0
0
3
2
Valiant
18.1
6
225
105
2.76
3.46
20.22
1
0
3
1
Duster 360
14.3
8
360
245
3.21
3.57
15.84
0
0
3
4
Merc 240D
24.4
4
146.7
62
3.69
3.19
20
1
0
4
2
Merc 230
22.8
4
140.8
95
3.92
3.15
22.9
1
0
4
2
Merc 280
19.2
6
167.6
123
3.92
3.44
18.3
1
0
4
4
Merc 280C
17.8
6
167.6
123
3.92
3.44
18.9
1
0
4
4
Merc 450SE
16.4
8
275.8
180
3.07
4.07
17.4
0
0
3
3
Merc 450SL
17.3
8
275.8
180
3.07
3.73
17.6
0
0
3
3
Merc 450SLC
15.2
8
275.8
180
3.07
3.78
18
0
0
3
3
Cadillac Fleetwood
10.4
8
472
205
2.93
5.25
17.98
0
0
3
4
Lincoln Continental
10.4
8
460
215
3
5.424
17.82
0
0
3
4
Chrysler Imperial
14.7
8
440
230
3.23
5.345
17.42
0
0
3
4
Fiat 128
32.4
4
78.7
66
4.08
2.2
19.47
1
1
4
1
Honda Civic
30.4
4
75.7
52
4.93
1.615
18.52
1
1
4
2
Toyota Corolla
33.9
4
71.1
65
4.22
1.835
19.9
1
1
4
1
Toyota Corona
21.5
4
120.1
97
3.7
2.465
20.01
1
0
3
1
Dodge Challenger
15.5
8
318
150
2.76
3.52
16.87
0
0
3
2
AMC Javelin
15.2
8
304
150
3.15
3.435
17.3
0
0
3
2
Camaro Z28
13.3
8
350
245
3.73
3.84
15.41
0
0
3
4
Pontiac Firebird
19.2
8
400
175
3.08
3.845
17.05
0
0
3
2
Fiat X1-9
27.3
4
79
66
4.08
1.935
18.9
1
1
4
1
Porsche 914-2
26
4
120.3
91
4.43
2.14
16.7
0
1
5
2
Lotus Europa
30.4
4
95.1
113
3.77
1.513
16.9
1
1
5
2
Ford Pantera L
15.8
8
351
264
4.22
3.17
14.5
0
1
5
4
Ferrari Dino
19.7
6
145
175
3.62
2.77
15.5
0
1
5
6
Maserati Bora
15
8
301
335
3.54
3.57
14.6
0
1
5
8
Volvo 142E
21.4
4
121
109
4.11
2.78
18.6
1
1
4
2
My script is below:
library(summarytools)
setwd("\\test\test files\Development\Sales and Marketing\3. Marketing\13. Team Member Files\Andrew\R_Projects\workdir")
mtcars1 <-read_excel("\\test\test files\Development\Sales and Marketing\3. Marketing\13. Team Member Files\Andrew\R_Projects\workdir\mtcars.xlsx",sheet="Sheet1")
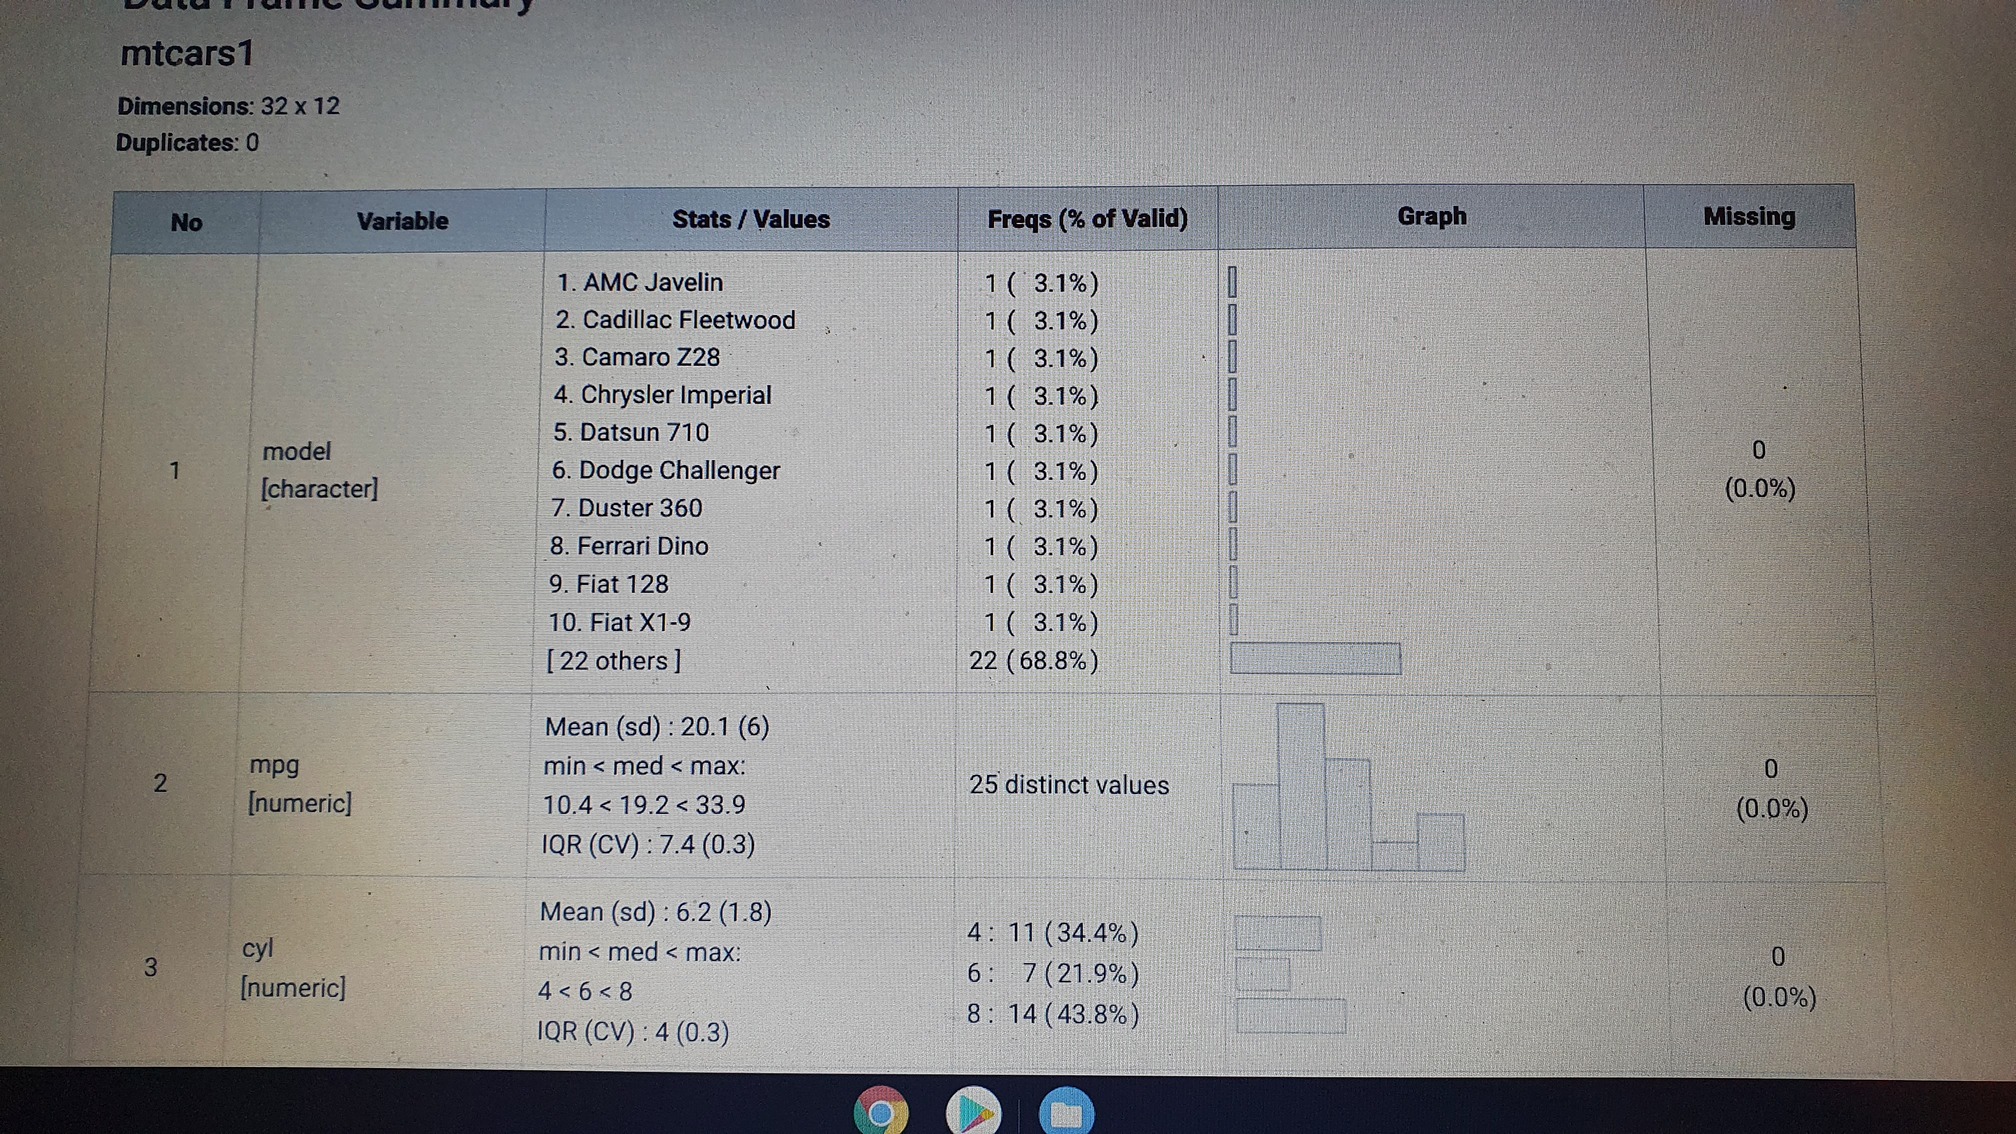
tmp2a<-dfSummary(mtcars1, plain.ascii = FALSE, style="grid", graph.magnif = 1, valid.col = FALSE, tmp.img.dir = "tmp",col.widths = c(2500,4000,3000,1000,5000,2500),caption="MT CARS")
view(tmp2a, file = "\\test.network\test Files\Development\Sales and Marketing\3. Marketing\13. Team Member Files\Andrew\R_Projects\workdir\tmp2a.html")
The output is below
No need to post the data from mtcars as everyone has access to it.
Do you mean that the chunk in the R markdown document is too wide when you output the table? If that is so, you can change the width options.
This book showcases short, practical examples of lesser-known tips and tricks to helps users get the most out of these tools. After reading this book, you will understand how R Markdown documents are transformed from plain text and how you may...
Otherwise, there are other packages like skimr that give good summaries.
Issue is thar what ever values I put in col.widths has little effect.
Where do I specify width option you mentioned,?
Tx
According to the vignette (section 2.4.1) , you should be able to run it in an Rmarkdown document.
You would use fig.width in the header of the code chunk of the RMarkdown document.
Thanks Williaml for all your help.
Andrew
1 Like
system
February 4, 2021, 5:53pm
8
This topic was automatically closed 21 days after the last reply. New replies are no longer allowed.