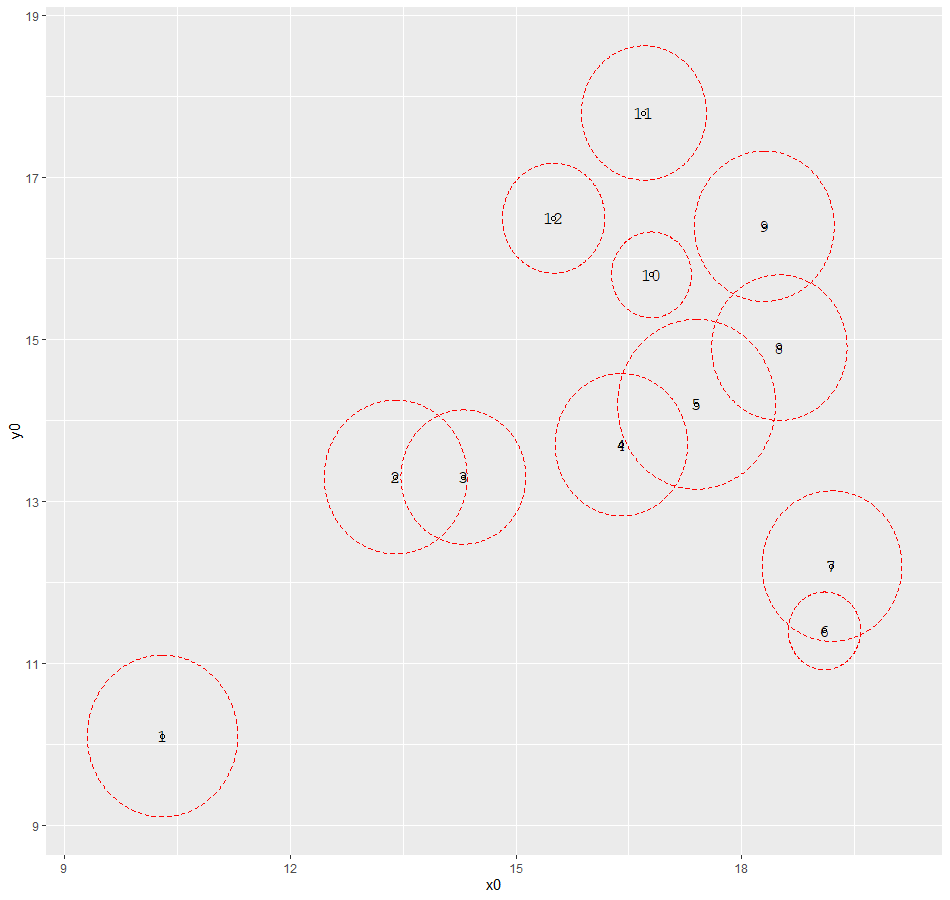
x1,y1 are the coordinates of the centre of the circle, r is the radius and id is the number of the corresponding circle. I want to draw each circle and output the data frame. The data frame contains whether the different circles intersect (T or F) and what is the area of the overlap section between the intersecting circle. Right now I have just drawn the diagram and calculated the area of each circle. I don't know what to do next. Thank you for your help in advance.
x1<-c(10.3,13.4,14.3,16.4,17.4,19.1,19.2,18.5,18.3,16.8,16.7,15.5)
y1<-c(10.1,13.3,13.3,13.7,14.2,11.4,12.2,14.9,16.4,15.8,17.8,16.5)
r<-c(1.00,0.95,0.83,0.88,1.05,0.48,0.93,0.90,0.93,0.53,0.83,0.68)
id<-c(1:12)
library(ggplot2)
library(ggforce)
circles<-data.frame(
  x0=x1,
  y0=y1,
  r=r,
  id=id
)
p<-ggplot(data = circles)+
  geom_point(aes(x=x0,y=y0),color="black",shape=1)+
  geom_circle(aes(x0=x0,y0=y0,r=r),
              data = circles,
              color = "red",
              alpha=0.05,
              linetype="dashed")+
  geom_text(aes(circles$x0,circles$y0,label=circles$id,size=3,angle=0,family="mono"))+
  theme(legend.position = 'none')
p
s<-data.frame(pi*(circles$r)^2)
colnames(s)<-"area"
circles<-cbind(circles,s)
``` r
<sup>Created on 2022-11-15 with [reprex v2.0.2](https://reprex.tidyverse.org)</sup>
