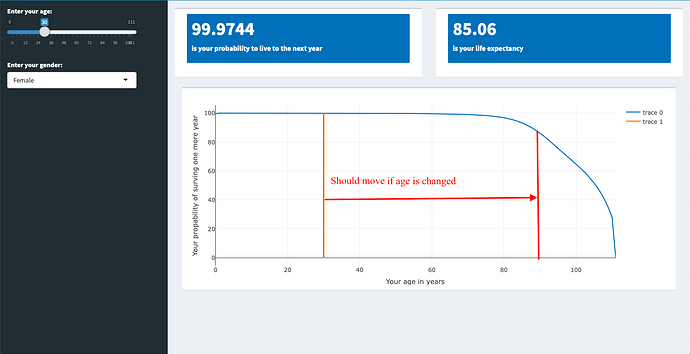
I am building a shiny dashboard showing various life expectancy data.
I have succeeded in creating reactive ValueBoxes and a reactive plot.
In my plot I want to use a reactive output. I get the following error message: replacement has length zero
Everything else is working fine. May I ask for help in this matter?
library(shiny)
library(shinydashboard)
library(ggplot2)
library(readxl)
library(plotly)


LifeExpCH <- read_excel("LifeExpCH.xlsx")
LifeExpCH_M <- read_excel("LifeExpCH_M.xlsx")


LifeExpectancyFromYear <- function(Age, Gender) {
    if(Gender == 0){

        Probability_to_live <- LifeExpCH$Plive[1:112]
        Age_in_Years <- seq(0, 111, 1)
        df1 <- data.frame(Age_in_Years, Probability_to_live)

    } else {

        Probability_to_live <- LifeExpCH_M$Plive[1:111]
        Age_in_Years <- seq(0, 110, 1)
        df1 <- data.frame(Age_in_Years, Probability_to_live)
    }
}


YourExpectancyFromAge <- function(Age, Gender) {
    if(Gender == 0){
        X <- which(LifeExpCH$Age == Age)
        LifeExp <- LifeExpCH$LifeExp[X] + Age
        print(LifeExp)


    } else {
        X <- which(LifeExpCH_M$Age == Age)
        LifeExp <- LifeExpCH_M$LifeExp[X] + Age
        print(LifeExp)
    }
}

YourProbability <- function(Age, Gender) {
    if(Gender == 0) {
        X <- which(LifeExpCH$Age == Age)
        Prob <- LifeExpCH$Plive[X]
        print(Prob)


    } else {

        X <- which(LifeExpCH_M$Age == Age)
        Prob <- LifeExpCH_M$Plive[X]
        print(Prob)

    }
}


header <- dashboardHeader(title = tags$b("Life Expectany in Switzerland, source: BEVNAT, ESPOP"), titleWidth = 750)

sidebar <- dashboardSidebar(
    width = 350,
    sliderInput("Age", "Enter your age:", value = 30, min = 0, max = 111),
    selectInput("Gender", "Enter your gender:", c("Female" = 0, "Male" = 1))

)

body <- dashboardBody(
    fluidRow(

        box(width = 6, valueBoxOutput(width = 12, "Prob")),
        box(width = 6, valueBoxOutput(width = 12, "LifeExp")),

    ),

    #Here I include the reactive output ("LifeProb") as I want to use it as input into my reactive plot
    box(width = 12, plotlyOutput(outputId = "Years_to_live")), uiOutput(outputId = "LifeProb")

)


ui <- dashboardPage(skin = "blue",
                    header = header,
                    sidebar = sidebar,
                    body = body)


server <- function(input, output){

    LifeExpectancy <- reactive({
        LifeExpectancyFromYear(input$Age, input$Gender)
    })
    output$Years_to_live <- renderPlotly({


        plot_ly(LifeExpectancy(), x = ~Age_in_Years, y = ~Probability_to_live,
        hoverinfo = "text",
        text = ~paste("If age:", Age_in_Years, "<br>", "Your probability to survive:", Probability_to_live)) %>%
        add_lines() %>%
        layout(xaxis = list(title = "Your age in years"),
            yaxis = list(title = "Your propability of surving one more year")) %>%

#yend = here I would like to use the reactive output
            add_segments(x = input$Age, xend = input$Age,  y = 0, yend = LifeProb
                         )


    })

    LifeExpectancyText <- reactive({
        YourExpectancyFromAge(input$Age, input$Gender)
    })

    output$LifeExp <- renderValueBox({
        valueBox(LifeExpectancyText(), tags$b("is your life expectancy"), color = "blue")
    })

#This is the reactive output I want to use for my plot

    LifeProb <- reactive({
        YourProbability(input$Age, input$Gender)
    })

    output$Prob <- renderValueBox({
        valueBox(LifeProb(), tags$b("is your probability to live to the next year"), color = "blue")
    })

}

shinyApp(ui = ui, server = server)
