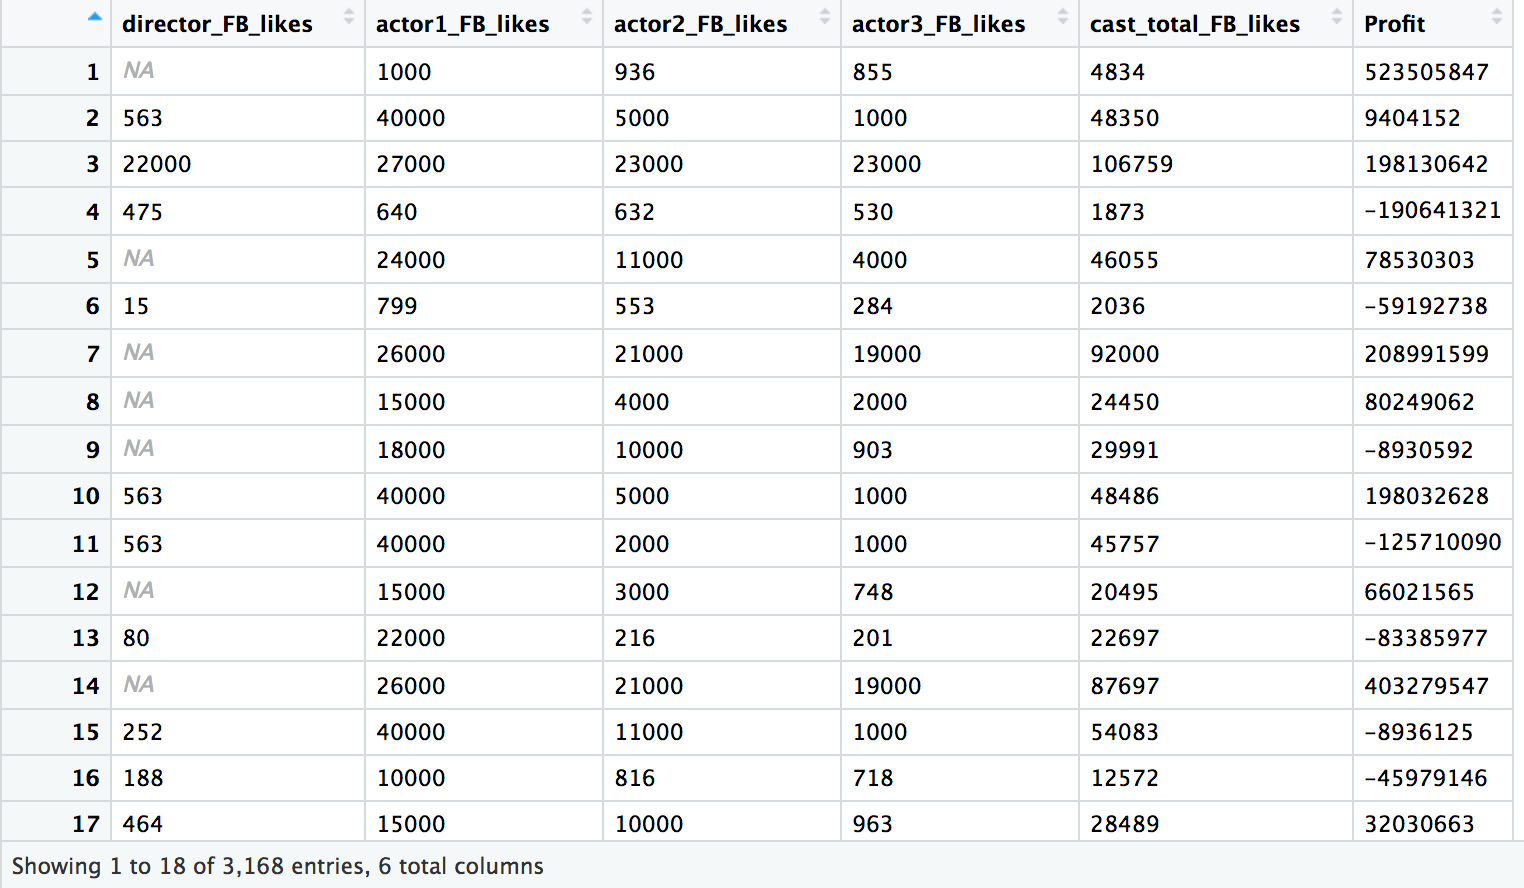
I have a data frame like this and I want to create a density plot for each of the first 5 column variables i.e. x=profit, y=..density..(?) and a different coloured line for each column variable. I also want the 'fill'/'area' under the density plot to correspond to each variable. I'm not sure how to do this though since there's more than one column (if that makes sense).
Hi. Screenshots are, unfortunately, singularly unhelpful. A reproducible example, called a reprex is far more useful and will get you more, and more useful answers. We're all lazy and unlikely to try to reverse engineer the data for a problem. It doesn't even actually have to be your data, so long as it's similar--in this case multiple continuous variables, like the famous mtcars, which you could cast as a similar five variable dataframe
mtcars[1:5]
The next step is to reduce the problem to its simplest case: what are you doing to plot the density of a single variable, say mtcars$mpg?
Also, should this apply, please review the homework policy
1 Like
I've checked the homework policy by the way - this is an altered version of what I have to do, so I assume it's okay?
Anyway, so for example:
A............. B............. C
10........... 20............ 70
NA.......... 23............ NA
7............. 27............ 120
6............. 16............ 40
3............. 12............ 35
4............. 18............ 63
Say with this example: I want to plot the density plot with column C along the x-axis and density on y. Then columns A and B to be different coloured density plots (on the same graph). I thought you'd have to use colour='some colour' in the aesthetics, but the colour isn't only based on one column. In the case above, it's based on 2. Hopefully this is easier to reproduce.
Please use a copy/paste friendly format like explained in this guide
Thanks, the actual data is not needed if we have data in the same form. But do see @andresrcs on reprex.
Again, let's start with the simple case of a density plot for a single column before moving on to complications for multiple columns. Post of reprex with your code to do that?
This topic was automatically closed 21 days after the last reply. New replies are no longer allowed.