I've been developing an R Shiny Application that allows users to view when and where select permit holders can park at a public university. When users select a permit type or interact with a data table, then a leaflet map responds by highlighting or zooming-in to particular location. The initial base map comes from custom tiles designed in Mapbox. Sometimes the user interactions work seamlessly, but often the labels, set view, or highlighted shapes will not respond until the user clicks and drags the map slightly.
Here are screenshots of two examples:
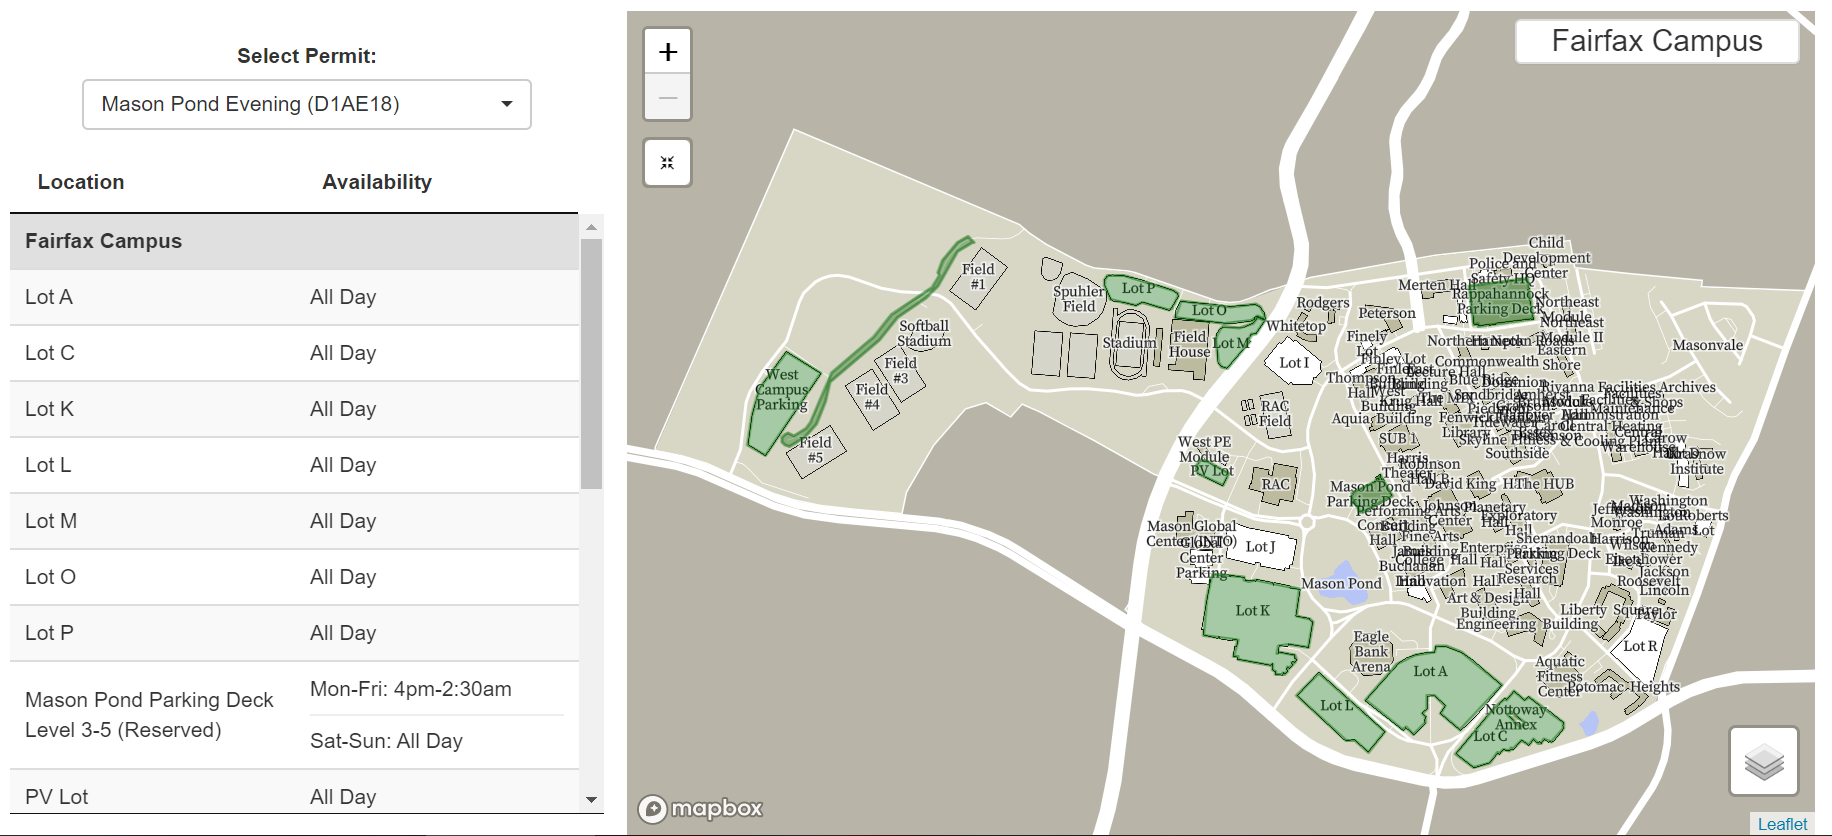
(All of the Mapbox labels are shown after zooming out with a mouse. The Mapbox labels are designed to resize or disappear based on zoom-level. The labels do resize/disappear, but only once you click & drag the map.)
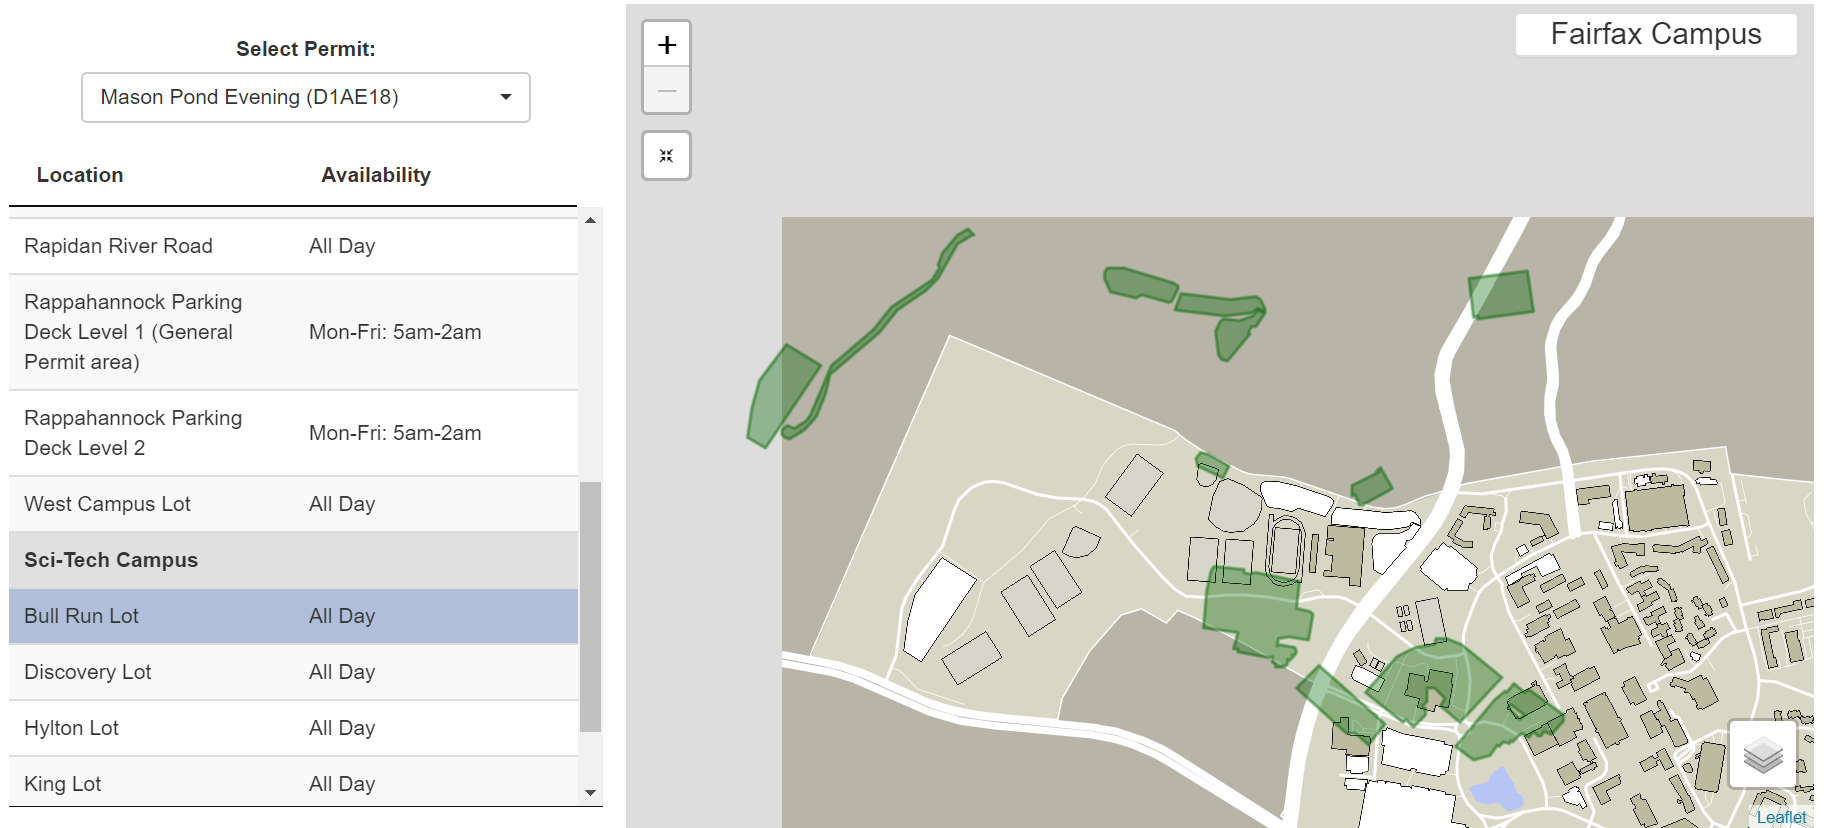
(The highlighted shapes and set view are misaligned when clicking on the reset view button
I'm not exactly sure what's causing these user-interaction problems, and am hoping someone could explain what's causing this problem. Or better yet, if anyone has any suggestions on how to fix the problem I would greatly appreciate it!
Shiny App: https://cypher-trial.shinyapps.io/Trial_Map/
Rdata file: https://github.com/ecypher/map_files_download/blob/master/.RData
www contents: https://github.com/ecypher/map_files_download/blob/master/GMU_Map_App_Demo.png
R Code:
#Mapbox Connection Access Token
options(mapbox.accessToken = 'pk.eyJ1IjoiZWN5cGhlciIsImEiOiJjanZxeHpuYmsxN3cyNGFyaHF1aDE0OTgwIn0.IqjTUny7tRSAeQlCpEAaDQ')
# Packages
library(sf)
library(shiny)
library(shinyWidgets)
library(shinyjs)
library(leaflet)
library(leaflet.extras)
library(leaflet.mapboxgl)
library(DT)
library(markdown)
library(tidyverse)
# User Interface Portion
ui <- fluidPage(
#Function called from Shiny app's UI in order for all other shinyjs functions to work
useShinyjs(),
#Creates Image Header for App, will be removed when App is placed on GMU server
div(img(src = "GMU_Map_App_Demo.png", height = "80px", width = "100%", align = "middle")),
p(),
column(width = 4, align = "center",
br(),
absolutePanel(id = "DataTable_Panel",
pickerInput("permit_type",label = "Select Permit:",
choices = c("Mason Pond Evening (D1AE18)",
"Mason Pond F/S (D1FA18)",
"Mason Pond Payroll Deductible (PRD1)",
"Mason Pond Student (D1SA18)",
"Shenandoah Evening (D2AE18)",
"Shenandoah F/S (D2FA18)",
"Shenandoah Payroll Deductible (PRD2)",
"Shenandoah Student (D2SA18)",
"Rappahannock F/S (D3FA18)",
"Rappahannock Payroll Deductible (PRD3)",
"Rappahannock Roof F/S (D3RO18)",
"Rappahannock Student (D3SA18)",
"F/S 9 Month (FF9M18)",
"F/S Annual (FFA18)",
"F/S Annual Sticker (FFAS18)",
"F/S Semester (FFL18/FFG18)",
"F/S Semester Sticker (FFLS18/FFGS18)",
"(PRFF)",
"Student 9 Month (FS9M18)",
"Student Annual (FSA18)",
"Student Annual Sticker (FSAS18)",
"Student Semester (FSL18/FSG18)",
"Student Semester Sticker (FSLS18/FSGS18)",
"Global Center F/S (GCFA18)",
"Global Center Student (GCSA18)",
"Lot M & P Annual (LMP18)",
"Lot M & P Semester (MPL18/MPG18)",
"Lot I (RIA18)",
"Lot J (RJA18)",
"Resident Lite (RLA18)",
"Lot R (RRA18)",
"Surface Reserved (SS18)",
"West Campus Annual (WC18)",
"West Campus Semester (WCL18/WCG18)",
"Foundation (FT18)",
"VA Elected Officials (VSL18)",
"Board of Visitors (BOV18)",
"Daily General (DG18)",
"Evening General (EG18)",
"Weekly General (WG18)",
"Monthly General (MG18)",
"Field House Daily (MOPD18)",
"Lot P Daily (LP18)",
"Field House Weekly (MOPW)",
"Field House Monthly (MOPM)",
"West Campus Daily (WCD)",
"West Campus Weekly (WCW)",
"West Campus Monthly (WCM)",
"Lot L & K (LK18)",
"Adjunct Lite (ADJ18)",
"Weekend (WKND)",
"(DP18)",
"(DC18)",
"RAC/AFC (TA18)",
"Swim Team (TS18)",
"Eagle Bank (EB18)"),
multiple = FALSE, selected = "Mason Pond Evening (D1AE18)", options = list(`actions-box` = TRUE,`none-selected-text` = "Nothing Selected",`live-search` = TRUE)),
dataTableOutput("Map_DT"))),
column(width = 8, leafletOutput("MAP_EXAMPLE", height = "550"),
absolutePanel(align = "middle",class = "panel panel-default", fixed = FALSE,
draggable = FALSE, top = 5, left = "auto", right = 25, bottom = "auto",
width = 190, height = 30,
htmlOutput("Campus_Label")
)))
# Define server logic required to draw a histogram
server <- function(input, output) {
#Produce Static Leaflet Map
output$MAP_EXAMPLE <- renderLeaflet({
leaflet(options = leafletOptions(dragging = TRUE,
minZoom = 15,
maxZoom = 18)) %>%
addMapboxGL(style = "mapbox://styles/ecypher/cjwl2kyq92f0m1cqxsq0ymp78", group = 'Mapbox') %>%
addProviderTiles('OpenStreetMap',group='OSM') %>%
addProviderTiles('Esri.WorldImagery',group='Satellite') %>%
addLayersControl(baseGroups=c('Mapbox','OSM','Satellite'),
position = "bottomright",
options = layersControlOptions(collapsed = TRUE)) %>%
setView(lng = -77.314, lat = 38.8320, zoom = 15) %>% #Complete Zoom Range ~[0:19]
addResetMapButton()
})
#User Selects Permit DT
selected_mapping_permit_type <- reactive({
switch(input$permit_type,
"Mason Pond Evening (D1AE18)" = sf_Permit_D1AE18,
"Mason Pond F/S (D1FA18)" = sf_Permit_D1FA18,
"Mason Pond Payroll Deductible (PRD1)" = sf_Permit_PRD1,
"Mason Pond Student (D1SA18)" = sf_Permit_D1SA18,
"Shenandoah Evening (D2AE18)" = sf_Permit_D2AE18,
"Shenandoah F/S (D2FA18)" = sf_Permit_D2FA18,
"Shenandoah Payroll Deductible (PRD2)" = sf_Permit_PRD2,
"Shenandoah Student (D2SA18)" = sf_Permit_D2SA18,
"Rappahannock F/S (D3FA18)" = sf_Permit_D3FA18,
"Rappahannock Payroll Deductible (PRD3)" = sf_Permit_PRD3,
"Rappahannock Roof F/S (D3RO18)" = sf_Permit_D3RO18,
"Rappahannock Student (D3SA18)" = sf_Permit_D3SA18,
"F/S 9 Month (FF9M18)" = sf_Permit_FF9M18,
"F/S Annual (FFA18)" = sf_Permit_FFA18,
"F/S Annual Sticker (FFAS18)" = sf_Permit_FFAS18,
"F/S Semester (FFL18/FFG18)" = sf_Permit_FFL18_FFG18,
"F/S Semester Sticker (FFLS18/FFGS18)" = sf_Permit_FFLS18_FFGS18,
"(PRFF)" = sf_Permit_PRFF,
"Student 9 Month (FS9M18)" = sf_Permit_FS9M18,
"Student Annual (FSA18)" = sf_Permit_FSA18,
"Student Annual Sticker (FSAS18)" = sf_Permit_FSAS18,
"Student Semester (FSL18/FSG18)" = sf_Permit_FSL18_FSG18,
"Student Semester Sticker (FSLS18/FSGS18)" = sf_Permit_FSLS18_FSGS18,
"Global Center F/S (GCFA18)" = sf_Permit_GCFA18,
"Global Center Student (GCSA18)" = sf_Permit_GCSA18,
"Lot M & P Annual (LMP18)" = sf_Permit_LMP18,
"Lot M & P Semester (MPL18/MPG18)" = sf_Permit_MPL18_MPG18,
"Lot I (RIA18)" = sf_Permit_RIA18,
"Lot J (RJA18)" = sf_Permit_RJA18,
"Resident Lite (RLA18)" = sf_Permit_RLA18,
"Lot R (RRA18)" = sf_Permit_RRA18,
"Surface Reserved (SS18)" = sf_SS18,
"West Campus Annual (WC18)" = sf_WC18,
"West Campus Semester (WCL18/WCG18)" = sf_WCL18_WCG18,
"Foundation (FT18)" = sf_FT18,
"VA Elected Officials (VSL18)" = sf_VSL18,
"Board of Visitors (BOV18)" = sf_BOV18,
"Daily General (DG18)" = sf_DG18,
"Evening General (EG18)" = sf_EG18,
"Weekly General (WG18)" = sf_WG18,
"Monthly General (MG18)" = sf_MG18,
"Field House Daily (MOPD18)" = sf_MOPD18,
"Lot P Daily (LP18)" = sf_LP18,
"Field House Weekly (MOPW)" = sf_MOPW,
"Field House Monthly (MOPM)" = sf_MOPM,
"West Campus Daily (WCD)" = sf_WCD,
"West Campus Weekly (WCW)" = sf_WCW,
"West Campus Monthly (WCM)" = sf_WCM,
"Lot L & K (LK18)" = sf_LK18,
"Adjunct Lite (ADJ18)" = sf_ADJ18,
"Weekend (WKND)" = sf_WKND,
"(DP18)" = sf_DP18,
"(DC18)" = sf_DC18,
"RAC/AFC (TA18)" = sf_TA18,
"Swim Team (TS18)" = sf_TS18,
"Eagle Bank (EB18)" = sf_EB18)
})
#Reactive Function subsets the user-selected row of previously chosen Permit DT
dynamic_marker_df <- reactive({
#Reactive value stores currently selected Permit DT as `current_selection_df` object
current_selection_df <- selected_mapping_permit_type()
#Saves row currently selected by User as `selected_row_id` object
selected_row_id <- input$Map_DT_rows_selected
#Subsets selected Permit DT to keep only the User selected row
dynamic_marker_df <- current_selection_df[selected_row_id,]
dynamic_marker_df
})
#Reactive function that maps all polygons in user-selected Permit DT
observe({
leafletProxy("MAP_EXAMPLE", data = selected_mapping_permit_type()) %>%
clearShapes() %>%
addPolygons(layerId = ~Location,
label = ~Popup_Text,
color = ~Color,
weight = 2,
fillColor = ~Color,
fillOpacity = 0.35,
highlightOptions = highlightOptions(color = "black",
weight = 2,
bringToFront = TRUE),
#Convoluted Way to Format the HTML Pop-up Text Box
labelOptions = labelOptions(
style = list('font-weight' = 'normal',
'width' = '160px',
'padding' = "2px 5px 2px 5px",
'border-color' = 'rgba(0,0,0,0.5)'
),
textsize = "12px",
direction = 'top')
)
})
#Find Longitude of Location that the user selected on current Permit DT
extract_marker_lng <- reactive({
extract_marker_lng <- dynamic_marker_df()
extract_marker_lng <- extract_marker_lng$Marker_Lng
})
#Find Latitude of Location that the user selected on current Permit DT
extract_marker_lat <- reactive({
extract_marker_lat <- dynamic_marker_df()
extract_marker_lat <- extract_marker_lat$Marker_Lat
})
leafIcons <- icons(
iconUrl = "https://raw.githubusercontent.com/ecypher/parkingmap/master/Map-Marker-Ball-Azure-icon.png",
iconWidth = 30, iconHeight = 28,
iconAnchorX = 0, iconAnchorY = 0)
#Places Icon on Map and Zooms toward Icon
observe({
shift_map <- leafletProxy("MAP_EXAMPLE", data = dynamic_marker_df()) %>%
clearMarkers() %>%
addMarkers(lng = ~Marker_Lng,
lat = ~Marker_Lat,
icon = leafIcons)
shift_map %>% setView(lng = extract_marker_lng(),
lat = extract_marker_lat(),
zoom = 17)
shift_map
})
##########################################################
#Change Campus Label Dynamically [Top Right Box]
campus_location_value <- reactive({
#Stores Center of Map view as a point
user_center_view <- st_point(c(input$MAP_EXAMPLE_center$lng,input$MAP_EXAMPLE_center$lat))
#Evaluates if the Center of Map View is within a polygon containing the Boundary of Fairfax Campus
TF_Fairfax_value <- as.numeric(st_contains(Boundary_Fairfax_Campus,user_center_view))
TF_Fairfax_value <- if(TF_Fairfax_value %in% NA){TF_Fairfax_value = 0} else {TF_Fairfax_value = 1}
#Evaluates if the Center of Map View is within a polygon containing the Boundary of Sci-Tech Campus
TF_Sci_Tech_value <- as.numeric(st_contains(Boundary_Sci_Tech_Campus,user_center_view))
TF_Sci_Tech_value <- if(TF_Sci_Tech_value %in% NA){TF_Sci_Tech_value = 0} else {TF_Sci_Tech_value = 1}
#Evaluates if the Center of Map View is within a polygon containing the Boundary of Arlington Campus
TF_Arlington_value <- as.numeric(st_contains(Boundary_Arlington_Campus,user_center_view))
TF_Arlington_value <- if(TF_Arlington_value %in% NA){TF_Arlington_value = 0} else {TF_Arlington_value = 1}
#Boolean Values Pasted Together to create code indenifying the appropiate campus label to display
campus_location_ID <- paste0(TF_Fairfax_value,TF_Sci_Tech_value,TF_Arlington_value)
campus_location_value <- switch (campus_location_ID,
"100" = "Fairfax Campus",
"010" = "Sci-Tech Campus",
"001" = "Arlington Campus")
campus_location_value
})
#Function that actually produces the dynamic, upper-right campus label
output$Campus_Label <- renderUI({
div(
style="font-size: 20px; position: relative;top: 50%;transform: translateY(-1%)",
HTML(markdownToHTML(fragment.only=TRUE, text=c(paste0(campus_location_value()))))
)
})
##########################################################
#Renders and formats the selected Permit DT
output$Map_DT <- renderDataTable({
datatable(selected_mapping_permit_type(), rownames = FALSE,
escape = FALSE,
selection = "single",
extensions = c('Scroller',"RowGroup"),
options = list(pageLength = 100,
columnDefs = list(list(visible = FALSE,targets = c(2:7)),
list(width = '50%', targets = c(0)),
list(width = '50%', targets = c(1))),
scrollY = "400px",
rowGroup = list(dataSrc = 6),
scrollCollapse = TRUE,
dom = 't', ordering = FALSE))
})
}
# Run the application
shinyApp(ui = ui, server = server)