Hello @nirgrahamuk,
thank you very much for your help! If I understand it correctly, you found a nice way to limit the y values to 100. (And the coefficient command shows me the actual function, thanks a lot). However, it seems to me that the function is now only meaningful up to a certain point (where y "naturally" reaches 100), after which the y values are artificially kept at 100, is that correct?
Maybe I can describe what I am looking for by giving an example:
The curve I am looking for is similar to a concentration increase ("invasion") with a specific saturation level. In pharmakokinetics this would look like this (though my application is not for pharmakokinetics):
("Konzentration" =concentration, "Zeit"=time)
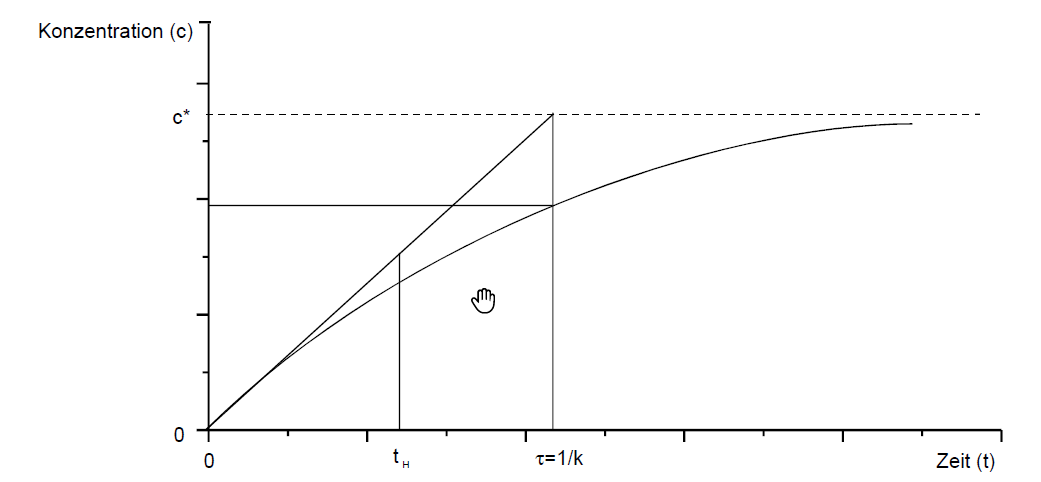
The corresponding formula would be:
dc(t)/dt = k(c*-c(t))
c=c*(1-e^-kt)
#with "-kt" being the exponent
(source: Sernetz et al.: https://www.researchgate.net/publication/265605774_Pharmakokinetik_und_Wachstumskinetik)
Now my question is: Can I perform a trend fitting in R, where I define how the formula has to look (e.g. as in the figure above) and R finds the missing konstants?
Thank you very much!
Best regards