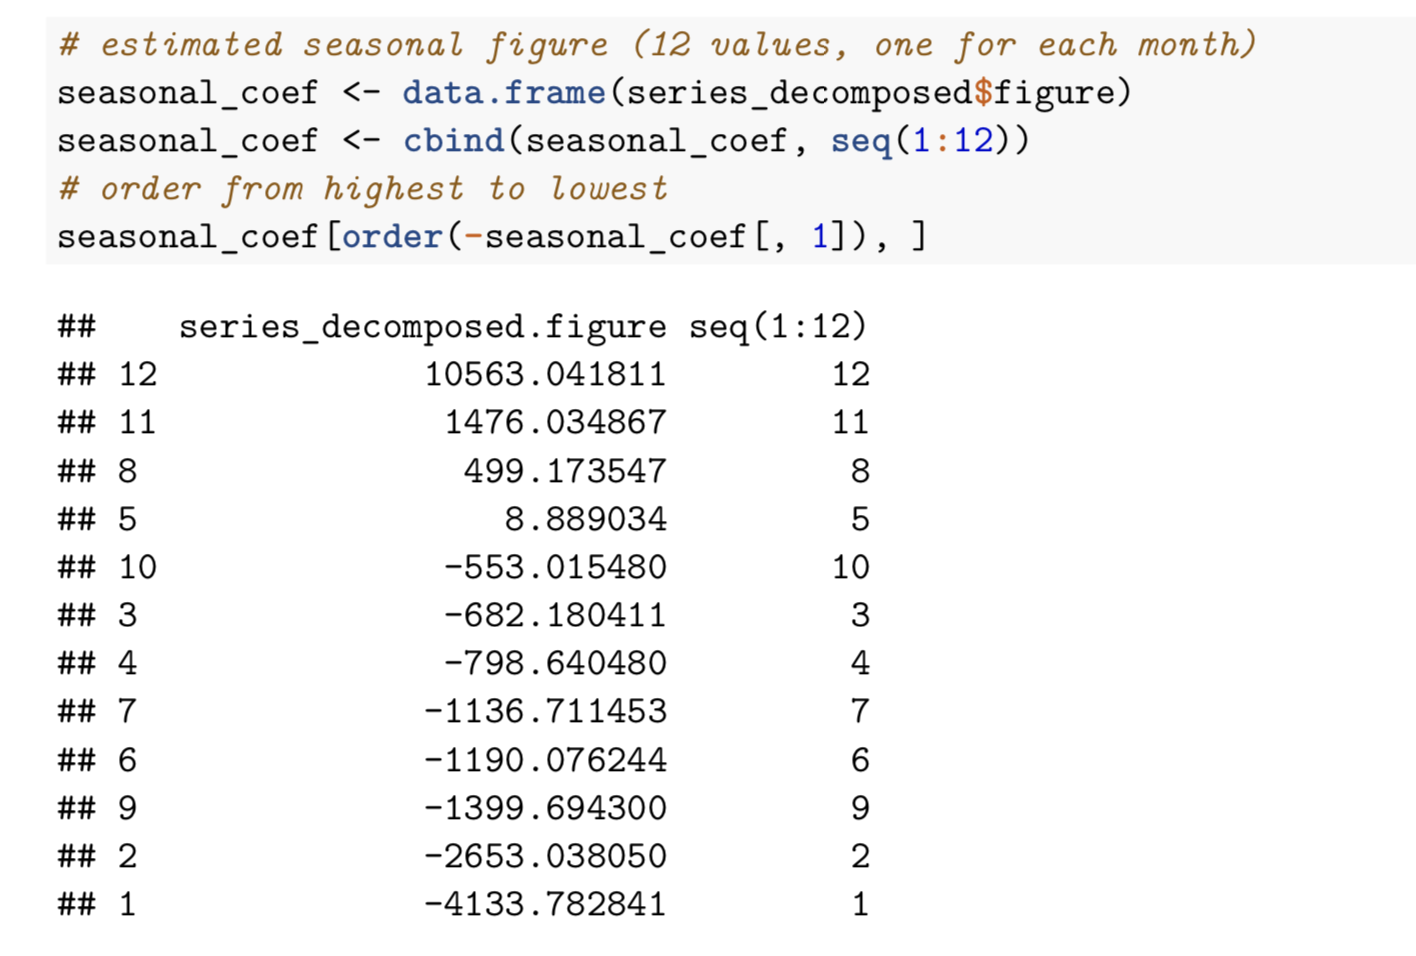
Hey, I am sorry if this question might be too easy for this forum! My task was to decompose a time series to break it into the different components. Then plot it in R. However, the correct solutions included the part that I uploaded as a picture. We are trying to identify the monthly data right? but why are we using the cbind and the data.frame function? than you very much in advance
That is just for visualization purposes, those lines are extracting part of the outcome into a new dataframe, adding a month index and finally, arranging the dataframe by the seasonal coefficient.
Thank you very much for your very helpful answer!
This topic was automatically closed 21 days after the last reply. New replies are no longer allowed.