I am new to the forum. I was instructed to come here by Hadley Wickham himself. I am trying to build a decision tree on the classical example by Witten (Data Mining). I can draw the tree by hand and can get it to work in WEKA. This tool produces the same tree I can draw by hand. I have Googled it and nobody seems to get the right answer. The raw data for the three is
    Outlook Temp Humidity Windy Play
1     Sunny  Hot     High FALSE   No
2     Sunny  Hot     High  TRUE   No
3  Overcast  Hot     High FALSE  Yes
4     Rainy Mild     High FALSE  Yes
5     Rainy Cool   Normal FALSE  Yes
6     Rainy Cool   Normal  TRUE   No
7  Overcast Cool   Normal  TRUE  Yes
8     Sunny Mild     High FALSE   No
9     Sunny Cool   Normal FALSE  Yes
10    Rainy Mild   Normal FALSE  Yes
11    Sunny Mild   Normal  TRUE  Yes
12 Overcast Mild     High  TRUE  Yes
13 Overcast  Hot   Normal FALSE  Yes
14    Rainy Mild     High  TRUE   No
I am using Play ~ Outlook+Temp+Humidity+Windy
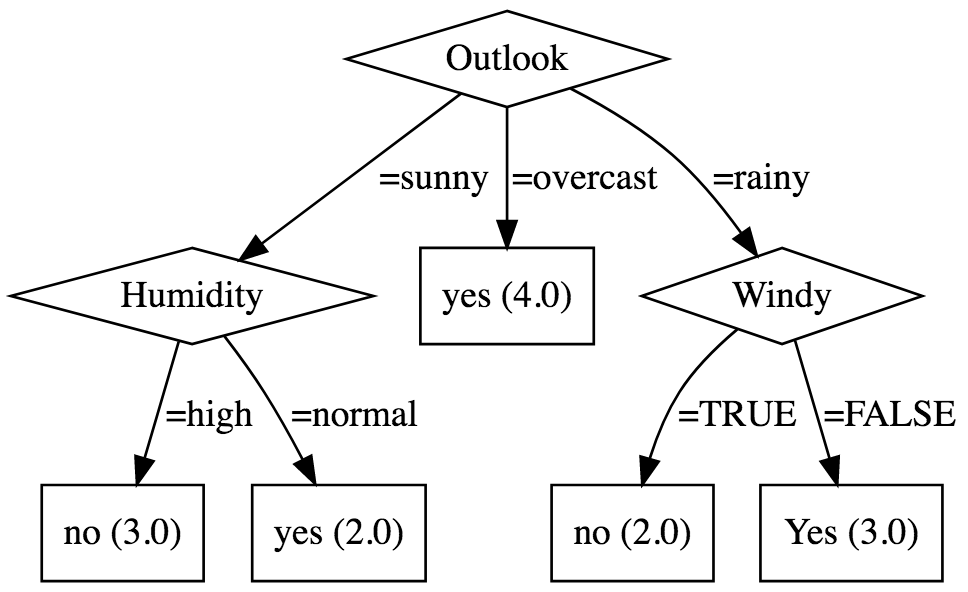
The root should be Outlook, the left child is Sunny, and the right child is Rainy. The middle child is the pure node Outcast. Sunny has Humidity as its child and Rainy has Windy. Sunny and Rainy have two terminal nodes and the tree ends.
I am teaching a class on this subject and this decision tree is driving me crazy because I cannot get it to look like the one I get in WEKA besides, some of the packages in RStudio tell me this is not a tree but a single node.
I want to know if anyone of you can help me, and my students, to figure this one out. I have drawn trees before but this one has all baffled. Any help from anybody?
My email is matatatora@jmu.edu if you want to comment directly. Thanks for all your help.
Ramon A. Mata-Toledo
When you build a tree using R, you will be (in most cases) fitting a statistical model of the data. Most tree models will have some heuristic to prune the branches to have a a sufficient number of leaves (observations) on each branch.
For example, using rpart() the default number of observations (minsplit) in every branch is 20. To change this default, you must specify a different argument to control.
Here is some example code to build a tree from your data. First read the data:
library(rpart)

dat <- read.table(text ="
    Outlook Temp Humidity Windy Play
1     Sunny  Hot     High FALSE   No
2     Sunny  Hot     High  TRUE   No
3  Overcast  Hot     High FALSE  Yes
4     Rainy Mild     High FALSE  Yes
5     Rainy Cool   Normal FALSE  Yes
6     Rainy Cool   Normal  TRUE   No
7  Overcast Cool   Normal  TRUE  Yes
8     Sunny Mild     High FALSE   No
9     Sunny Cool   Normal FALSE  Yes
10    Rainy Mild   Normal FALSE  Yes
11    Sunny Mild   Normal  TRUE  Yes
12 Overcast Mild     High  TRUE  Yes
13 Overcast  Hot   Normal FALSE  Yes
14    Rainy Mild     High  TRUE   No",
                  stringsAsFactors = FALSE)
Now fit the model:
model <- rpart(
Play ~ Outlook + Temp + Humidity + Windy,
data = dat,
control = rpart.control(minsplit = 2))
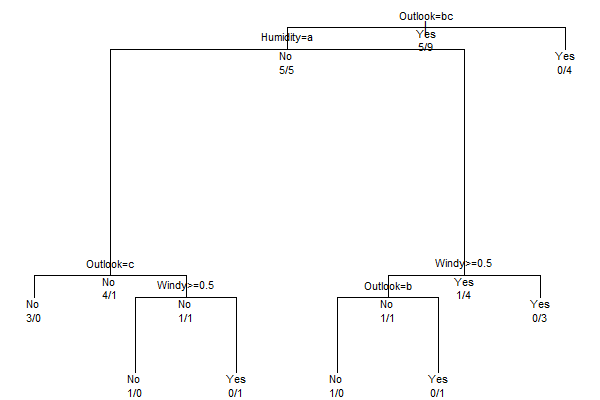
par(xpd = NA, mar = rep(0.7, 4))
plot(model, compress = TRUE)
text(model, cex = 0.7, use.n = TRUE, fancy = FALSE, all = TRUE)
February 25
When you build a tree using R, you will be (in most cases) fitting a statistical model of the data. Most tree models will have some heuristic to prune the branches to have a a sufficient number of leaves (observations) on each branch.
For example, using rpart() the default number of observations (minsplit) in every branch is 20. To change this default, you must specify a different argument to control.
Here is some example code to build a tree from your data. First read the data:
>
> library(rpart) dat <- read.table(text =" Outlook Temp Humidity Windy Play 1 Sunny Hot High FALSE No 2 Sunny Hot High TRUE No 3 Overcast Hot High FALSE Yes 4 Rainy Mild High FALSE Yes 5 Rainy Cool Normal FALSE Yes 6 Rainy Cool Normal TRUE No 7 Overcast Cool Normal TRUE Yes 8 Sunny Mild High FALSE No 9 Sunny Cool Normal FALSE Yes 10 Rainy Mild Normal FALSE Yes 11 Sunny Mild Normal TRUE Yes 12 Overcast Mild High TRUE Yes 13 Overcast Hot Normal FALSE Yes 14 Rainy Mild High TRUE No", stringsAsFactors = FALSE)
Now fit the model:
> model <- rpart( Play ~ Outlook + Temp + Humidity + Windy, data = dat, control = rpart.control(minsplit = 2)) par(xpd = NA, mar = rep(0.7, 4)) plot(model, compress = TRUE) text(model, cex = 0.7, use.n = TRUE, fancy = FALSE, all = TRUE)
Andrie: Thanks for taking time to answer my question and explaining something about R I did not know. I even called you an Angel for this. However, I have one more question for you. Although, I agree with you that Outlook is the root and Humidity and Windy
are the branches. However, once you make a decision at the root level with Outlook, this attribute should not appear anywhere else in the tree. The algorithm to build the tree should divide the "space" into nonoverlapping "subspaces". Therefore, Outlook should
not appear again at all in the remaining branches of the tree. I am attaching a picture of what the tree should look like. I would like to hear your opinion on this.
dat <- read.table(text ="
Outlook Temp Humidity Windy Play
1 Sunny Hot High FALSE No
2 Sunny Hot High TRUE No
3 Overcast Hot High FALSE Yes
4 Rainy Mild High FALSE Yes
5 Rainy Cool Normal FALSE Yes
6 Rainy Cool Normal TRUE No
7 Overcast Cool Normal TRUE Yes
8 Sunny Mild High FALSE No
9 Sunny Cool Normal FALSE Yes
10 Rainy Mild Normal FALSE Yes
11 Sunny Mild Normal TRUE Yes
12 Overcast Mild High TRUE Yes
13 Overcast Hot Normal FALSE Yes
14 Rainy Mild High TRUE No"
)
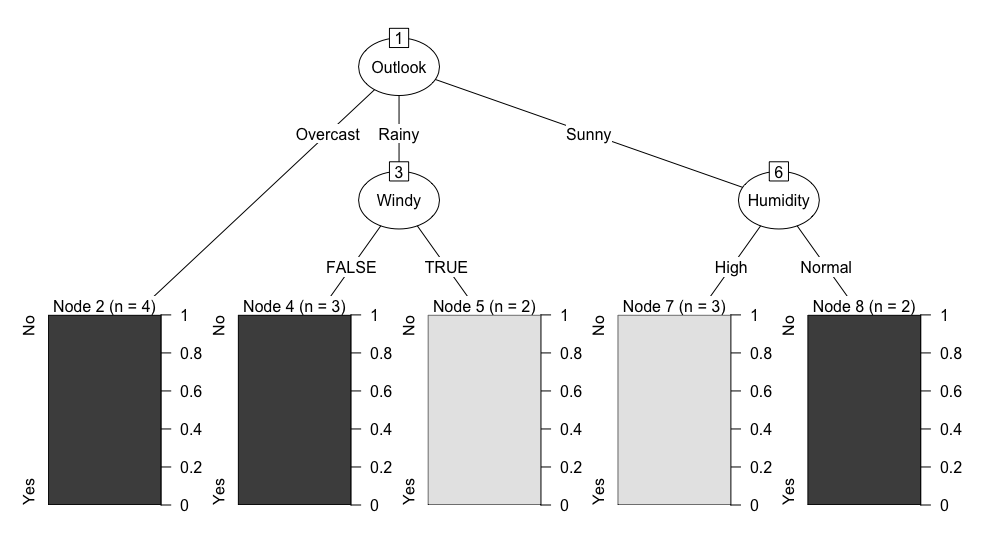
dat$Windy <- as.factor(dat$Windy)
library(C50)
c5_mod <- C5.0(Play ~ Outlook + Temp + Humidity + Windy, data = dat)
plot(c5_mod)