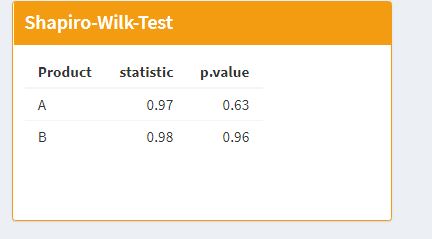
Hello everybody, I am creating the shapiro-wilk test table using dplyr packages for groupwise operations. It looks like this in R Shiny:
and this is the code:
#Output for normality test according to group
  output$normTable <- renderTable({
    Data <- df_sel()
    if(is.null(Data)) {return(NULL)}
    if(input$normTest==TRUE){
      Data %>% group_by_(input$indStat)%>%
      summarize_at(vars(input$depStat),funs(statistic = shapiro.test(.)$statistic,
                   p.value= shapiro.test(.)$p.value))
    }
  })
But the problem is that the output always given in 2 decimal places. When I tried in R Console, it gives the full value of the results with 3 decimal places. This is how it looks like in R Console:
> data %>% group_by(Product) %>% summarise(statistic = shapiro.test(dWeight_V3.V1)$statistic, p.value=shapiro.test(dWeight_V3.V1)$p.value)
`summarise()` ungrouping output (override with `.groups` argument)
# A tibble: 2 x 3
  Product statistic p.value
  <chr>       <dbl>   <dbl>
1 A           0.969   0.632
2 B           0.985   0.963
I want to have the full values. Can anyone help me with this one?