Good morning everyone,
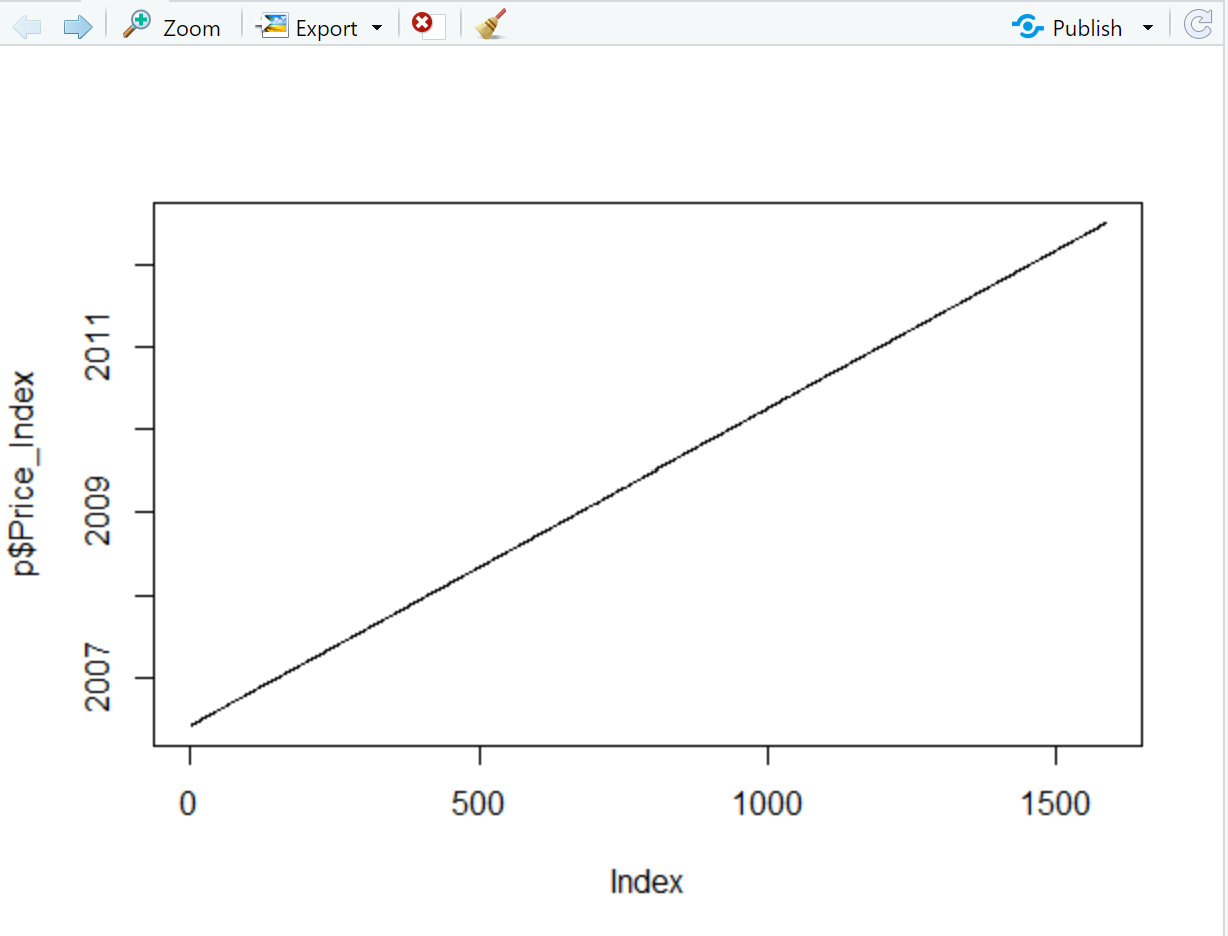
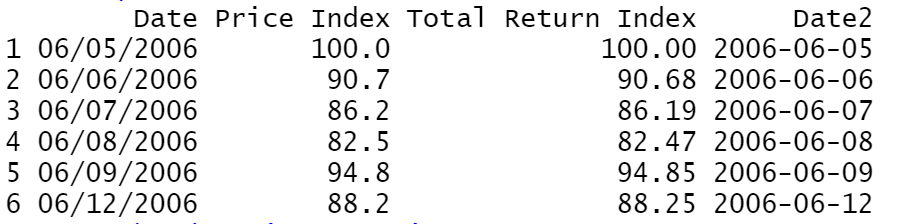
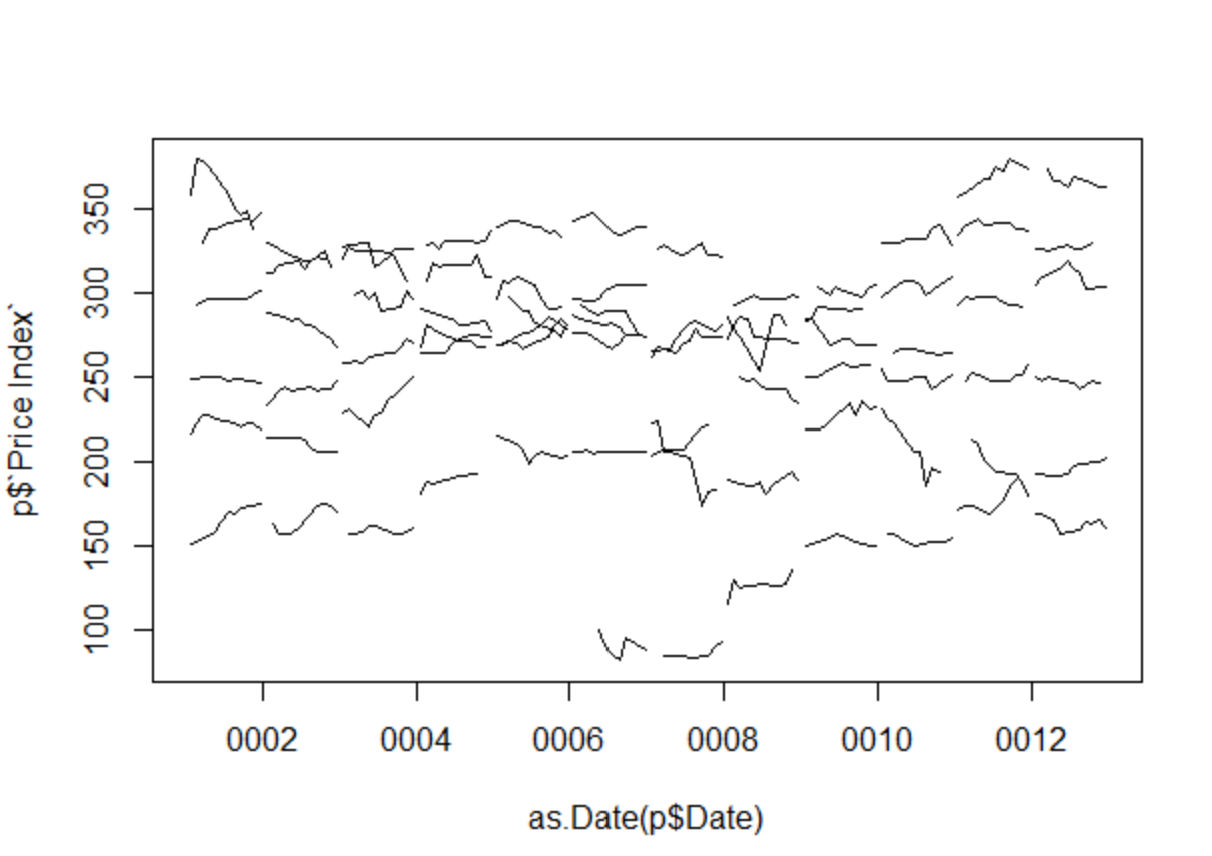
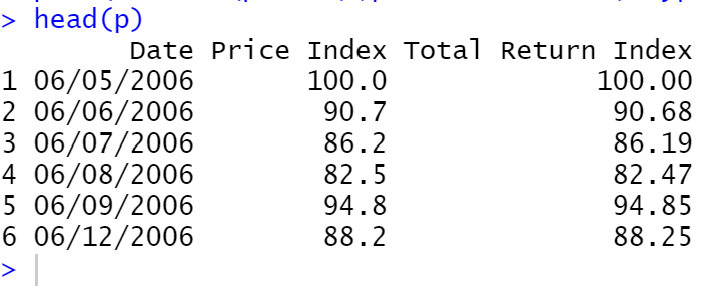
I want to represent a graph with dates on the x-axis and prices on the y-axis. When I import the CVS document, I have no problem. Each type of information is in its column, and the dates are in a suitable format. But when I try to graph this data. I get non-conforming lines, and the date format is not the same (now: 0002, 0004, 0006, 0008, 0010, etc...). What can I do?
I thank you in advance.
Here is my code and the pictures:
#Put the data in a matrix p
p <-read.csv("JSE_Price_index_and_Total_Returns1.csv", header = TRUE , sep = ",")
names(p)
names(p)<-c("Date","Price Index","Total Return Index")
#Adjust maybe date format - i don't knowv
????
#Representer Price Index - plot:
plot(as.Date(p$Date),p$Price Index, type = "l", col="black", lwd = 1)
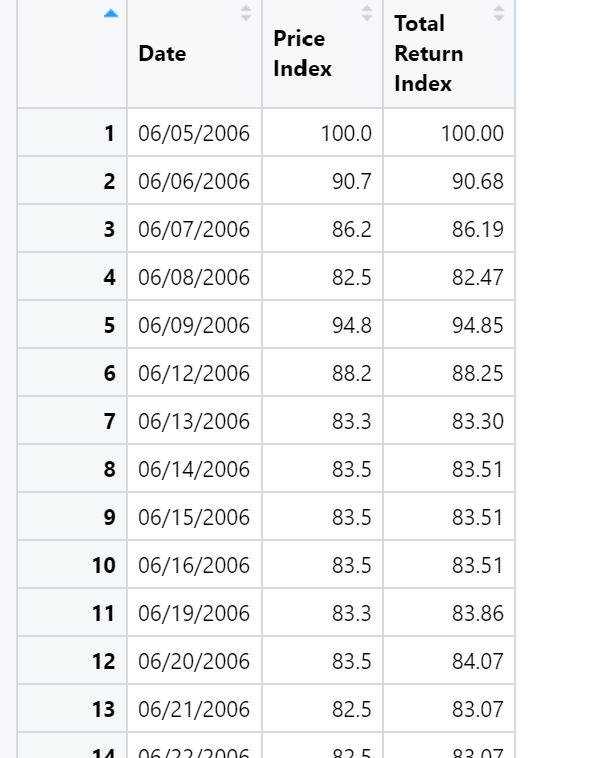
 ,
,