Dataframe that is not real dataframe with proper colnames

Hi All,

Here is my code:

irrigacje <- structure(list(irrigationes = structure(c(1L, 1L, 1L, 1L, 1L,
1L, 1L, 1L, 1L, 1L, 2L, 2L, 2L, 2L, 2L, 2L, 2L, 2L, 2L, 2L, 3L,
3L, 3L, 3L, 3L, 3L, 3L, 3L, 3L, 3L), levels = c("Control", "Irrigated 10\nmm",
"Irrigated 20 mm"), class = "factor", contrasts = structure(c(0,
1, 0, 0, 0, 1), dim = 3:2, dimnames = list(c("Control", "Irrigated 10\nmm",
"Irrigated 20 mm"), c("Irrigated 10\nmm", "Irrigated 20 mm")))),
    biomass = 1:30), row.names = c(NA, -30L), class = "data.frame")

# Calculate group statistics
group_stats <- aggregate(biomass ~ irrigationes, data = irrigacje,
                         function(x) c(mean = mean(x), min = min(x), max = max(x)))

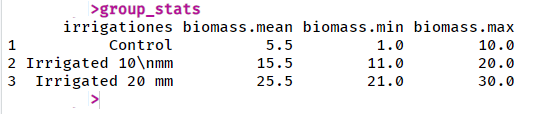
group_stats in console:

obraz

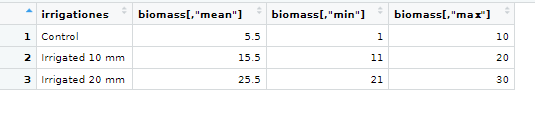
group_stats in View():

obraz

colnames(group_stats) 
[1] "irrigationes" "biomass"

typeof(group_stats)
[1] "list"

class(group_stats)
[1] "data.frame"

What is going on here ? How to convert it to real dataframe that I could have proper colnames in it and export it to excel properly ?
Is it possible to edit it in RStudio ? Fix() or edit() don't work with it somehow.

Hello @Andrzej ,

apparently your group_stats variable is a data.frame with two colums:
the control variable in the first and a vector with the results in the second column.

Use the dplyr summarize function if you want each result in its own column. See below

irrigacje <- structure(list(irrigationes = structure(c(1L, 1L, 1L, 1L, 1L,
                                                       1L, 1L, 1L, 1L, 1L, 2L, 2L, 2L, 2L, 2L, 2L, 2L, 2L, 2L, 2L, 3L,
                                                       3L, 3L, 3L, 3L, 3L, 3L, 3L, 3L, 3L), levels = c("Control", "Irrigated 10\nmm",
                                                                                                       "Irrigated 20 mm"), class = "factor", contrasts = structure(c(0,
                                                                                                                                                                     1, 0, 0, 0, 1), dim = 3:2, dimnames = list(c("Control", "Irrigated 10\nmm",
                                                                                                                                                                                                                  "Irrigated 20 mm"), c("Irrigated 10\nmm", "Irrigated 20 mm")))),
                            biomass = 1:30), row.names = c(NA, -30L), class = "data.frame")

# Calculate group statistics
group_stats <- aggregate(biomass ~ irrigationes, data = irrigacje,
                         function(x) c(mean = mean(x), min = min(x), max = max(x)))

dim(group_stats) 
#> [1] 3 2
print(group_stats[,2])
#>      mean min max
#> [1,]  5.5   1  10
#> [2,] 15.5  11  20
#> [3,] 25.5  21  30
print(group_stats[1,2])
#>      mean min max
#> [1,]  5.5   1  10

# using the package dplyr

group_stats_dplyr <- irrigacje |>
  dplyr::group_by(irrigationes) |>
  dplyr::summarize(biomass.mean=mean(biomass),biomass.min=min(biomass),biomass.max=max(biomass))

print(group_stats_dplyr)
#> # A tibble: 3 × 4
#>   irrigationes       biomass.mean biomass.min biomass.max
#>   <fct>                     <dbl>       <int>       <int>
#> 1 "Control"                   5.5           1          10
#> 2 "Irrigated 10\nmm"         15.5          11          20
#> 3 "Irrigated 20 mm"          25.5          21          30
Created on 2023-08-14 with reprex v2.0.2

Hi,
So why when I use View(group_stats) it shows 4 columns and in console as well ?

When you display one vector with three elements do you expect to see one number or three?

I do not understand, for me it is a bit mystery that I can see 4 columns displayed with viewer but somehow R tells me that it has got 2 columns.

When in doubt examine the structure

irrigacje <- structure(list(
  irrigationes = structure(c(
    1L, 1L, 1L, 1L, 1L,
    1L, 1L, 1L, 1L, 1L, 2L, 2L, 2L, 2L, 2L, 2L, 2L, 2L, 2L, 2L, 3L,
    3L, 3L, 3L, 3L, 3L, 3L, 3L, 3L, 3L
  ), levels = c(
    "Control", "Irrigated 10\nmm",
    "Irrigated 20 mm"
  ), class = "factor", contrasts = structure(c(
    0,
    1, 0, 0, 0, 1
  ), dim = 3:2, dimnames = list(c(
    "Control", "Irrigated 10\nmm",
    "Irrigated 20 mm"
  ), c("Irrigated 10\nmm", "Irrigated 20 mm")))),
  biomass = 1:30
), row.names = c(NA, -30L), class = "data.frame")

# Calculate group statistics
group_stats <- aggregate(biomass ~ irrigationes,
  data = irrigacje,
  function(x) c(mean = mean(x), min = min(x), max = max(x))
)

str(group_stats)
#> 'data.frame':    3 obs. of  2 variables:
#>  $ irrigationes: Factor w/ 3 levels "Control","Irrigated 10\nmm",..: 1 2 3
#>   ..- attr(*, "contrasts")= num [1:3, 1:2] 0 1 0 0 0 1
#>   .. ..- attr(*, "dimnames")=List of 2
#>   .. .. ..$ : chr [1:3] "Control" "Irrigated 10\nmm" "Irrigated 20 mm"
#>   .. .. ..$ : chr [1:2] "Irrigated 10\nmm" "Irrigated 20 mm"
#>  $ biomass     : num [1:3, 1:3] 5.5 15.5 25.5 1 11 21 10 20 30
#>   ..- attr(*, "dimnames")=List of 2
#>   .. ..$ : NULL
#>   .. ..$ : chr [1:3] "mean" "min" "max"
group_stats[,1]
#> [1] Control          Irrigated 10\nmm Irrigated 20 mm 
#> attr(,"contrasts")
#>                  Irrigated 10\nmm Irrigated 20 mm
#> Control                         0               0
#> Irrigated 10\nmm                1               0
#> Irrigated 20 mm                 0               1
#> Levels: Control Irrigated 10\nmm Irrigated 20 mm
group_stats[,2]
#>      mean min max
#> [1,]  5.5   1  10
#> [2,] 15.5  11  20
#> [3,] 25.5  21  30

Created on 2023-08-15 with reprex v2.0.2

for your convenience, add simplify=FALSE to the aggregate, and then you can unnest_wider

# Calculate group statistics
group_stats <- aggregate(biomass ~ irrigationes, data = irrigacje,
                         function(x) c(mean = mean(x), min = min(x), max = max(x)),
                         simplify=FALSE)
group_stats |> unnest_wider(col="biomass", names_sep="_")

or replace aggregate and unnest with a single summarise


group_stats2 <- summarise(irrigacje,
                          .by = irrigationes,
                          across(biomass,list(mean=mean,
                                              min=min,
                                              max=max)))

Thank you, this is what I wanted.

One more option and simply the best seems to be, as I have figured it out:

group_stats <- aggregate(biomass ~ irrigationes, data = irrigacje,
                         function(x) c(mean = mean(x), min = min(x), max = max(x)))

group_stats <- do.call(data.frame, group_stats)

and that's it.

I do not know why this below code is not working:

group_stats <- group_stats %>% as.data.frame()

#or this neither: 
group_stats <- group_stats %>% data.frame()

but works perfectly when data.frame() is combined with do.call().

Any explanation for this, please ?

This topic was automatically closed 7 days after the last reply. New replies are no longer allowed.

If you have a query related to it or one of the replies, start a new topic and refer back with a link.