I am reaching out because I have a data set that I want to sort through that I think would be very easy for everyday R studio users compared to myself who has some basic knowledge.
I have a data sheet that shows chemical detections and non detections for specific monitoring well locations that were sampled. Each well gets sampled the same way against the same chemicals and we receive a table that shows their results. For my job, i am asked to create an individual excel box or " chembox" as we like to call it that displays all the detections and exceedances that are given in the data set. Each box can not show a chemical that has a non-detection. Generally, these get created in excel, but there tends to be a lot of human error in this process.
If anyone has had experience with something like this I would greatly appreciate some insight!
I am not sure I understand your terminology but is sounds like you simply want to select all the wells that exceeds some standard and then present the output in a table?
This sounds almost too simple so I must be missing something. If the data is not confidential can you supply us with an example of a chembox or even a screenshot of one?
We probably need some data (real or mock-up should do). See FAQ Asking Questions for some general comments on asking questions here. Much of it will not apply but it can be helpful.
If you have the data in R, then a handy way to supply some sample data is the dput() function. In the case of a large dataset something like dput(head(mydata, 100)) should supply the data we need. Just do dput(mydata) where mydata is your data. Copy the output and paste it here between
```
```
Is not, posting the Excel file at a file-sharing site such as Dropbox or Mediafire and posting the link here is a possible solution
Thanks for reaching out John. I think some visuals would help out. Let me post a few screenshots and show you what the data looks like raw vs the final product.
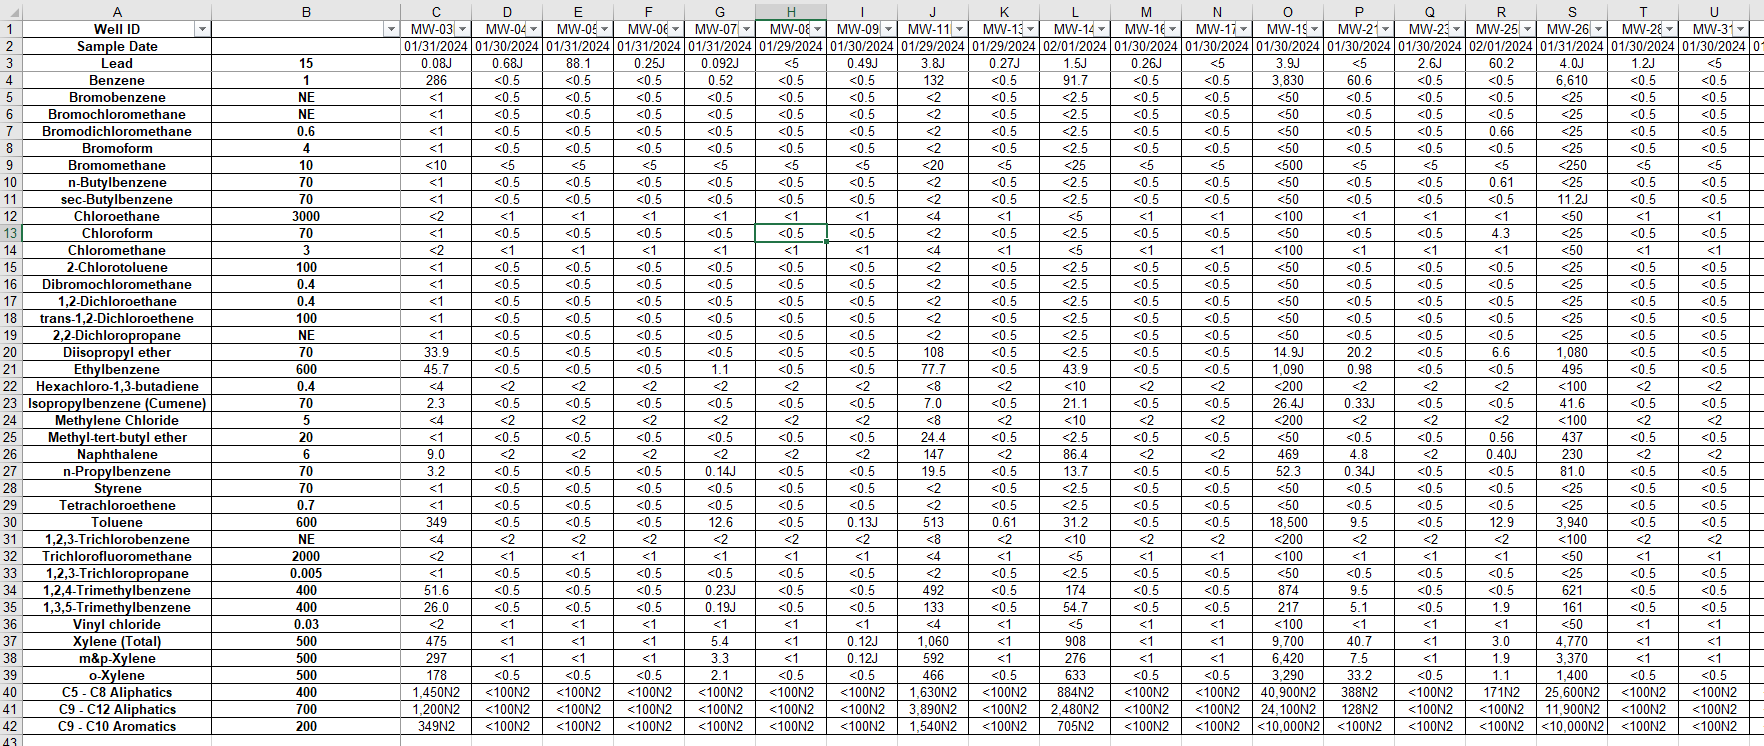
This screenshot here has the chemicals in column A, with the exceedance level in column B, and then each well with the corresponding results is in all the columns after. Anything that contains the text "<" is considered a non detect and would not be in the final product screenshot that will follow. Anything that does exceed gets a bolded value in the output table while if there is just a detection it gets a non bolded value.
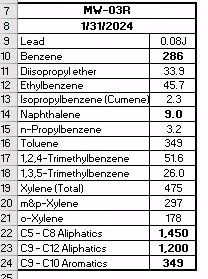
Here is the output example for the first well in column C as the final output
screenshot here should help elaborate more
Let me know if this clarifies a few things up
I see why you say, "…there tends to be a lot of human error in this process".
This is a perfect example of why I have coined the motto: Friends don't let friends use spreadsheets.
The screenshot clarifies that you have a data nightmare on your hands, but I suspect that some of our more more talented data wranglers can do something with it. I am not sure I am that talented.
If I understand this correctly a "<1" and a "<4" both mean that the result is a "non-detect" and does not show up in the "chembox". Is this correct?
I think I vaguely see what is happening. Toluene is detected but is below 600 so it is in the table but not in bold. Is this correct?
What are the aliphatics doing? Those scores in Column C are not numeric. Oh, Iwait, now I sse you are stripping off the NO2.
I'd say once we figure out what is happening we should be able to deliver much more accurate results in a much reduced time frame.
Still, the key thing here is likely to be getting our hands on the actual data. See my suggestions above.
Each well undergoes the same sampling procedure for various chemicals, and we receive a table summarizing the results. My task involves creating individual "chemboxes" in Excel, which display detections and exceedances from the dataset. There's a caveat: each chembox should only display chemicals with detections, omitting those with non-detections. While this task is typically done manually in Excel, it's prone to human error, leading to inefficiencies.
Sorry for the delay on getting people data for this question. I will attach the table that i work with in order to make those chemical boxes. I will also post the chemical boxes too here as the final example.
Excellent. It looks like everything has downloaded cleanly and I can read the data with no problem.
I'll have a look at it tomorrow. Its a bit late here (20:05 Eastern NA) to start anything this evening.
As I mentioned, I am not sure I have the skill to pull off a really clean solution but I'll have a stab at it. I am pretty sure I can do something much better than a spreadsheet even if is by brute force and stupidity.
Some of our better data wranglers should be able to do something with elegance.
No problem! i appreciate all the help of looking into this matter for me.
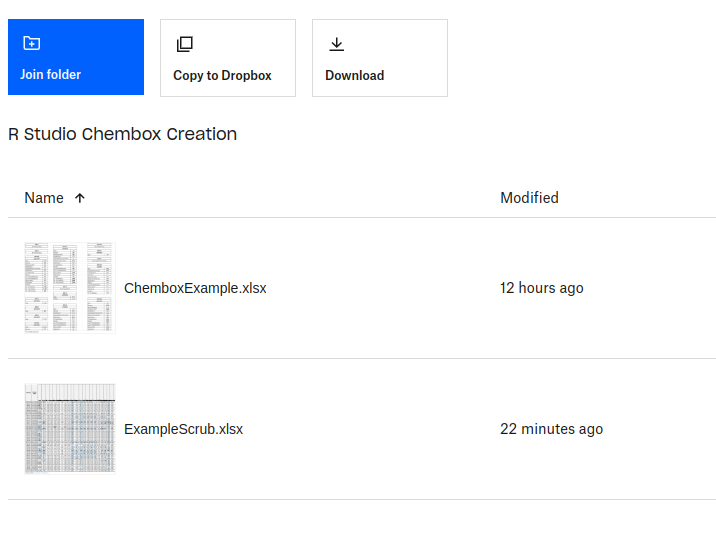
Please note, i have updated that folder to contain the correct excel sheet(s). Please do not use that CSV and PDF you previously saw in the folder. I am uploading the link again here.
Ack, I think this thread in the forum has expired! I cannot find it anywhere just by scrolling through the forum and if I cannot find it it is possible no one else will see it. Unless, of course my system is mucked up.
Can I ask you to start a totally new thread? Sorry but I don't think I have ever seen quite such a nasty spreadsheet and I will need help.
I'd suggest your request, a screenshot of the spreadsheet and a link to the files.
Yes I definitely have something messed up. It is easy enough to find the thread with a search now I know I have a problem. I think i was not searching correctly before. I do not find the forum layout all that intuitive. Oh well, a fun morning ahead of me.
It looks like I may be caught in some category trap.