Dashed edges and nodes in reactlog

I just ran the reactlog demo and I was curious what do the dashed edges and nodes mean? (See picture)

library(shiny)
library(reactlog)

# tell shiny to log all reactivity
options(shiny.reactlog = TRUE)

# run a shiny app
app <- system.file("examples/01_hello", package = "shiny")
runApp(app)


Referred here by reactlog's README

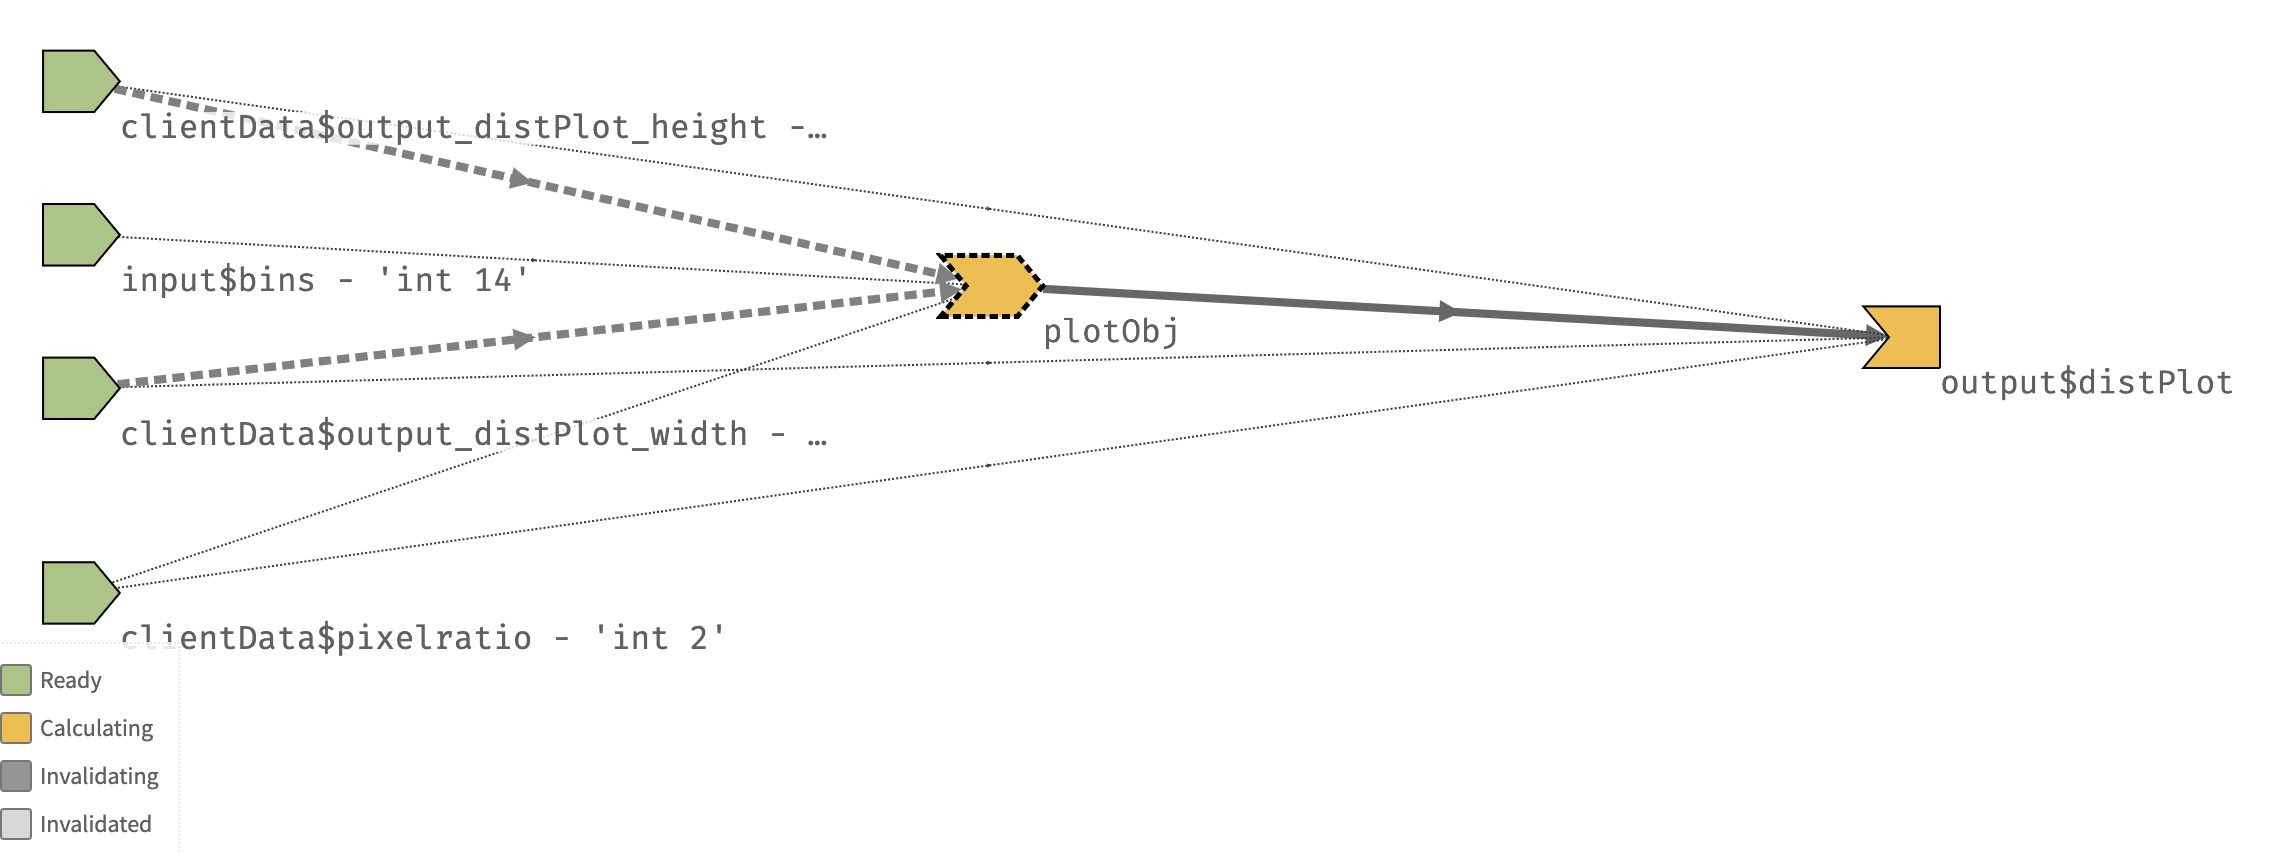
The dashed lines represent shiny::isolate() calls.

In the picture above, plotObj is currently executing an isolate command and is retrieving the height and width of distPlot.

When a reactive object is retrieved within an isolate() command, there is not direct dependency created. reactlog does display that the value was read (by using dashed lines), which also signals that plotObj will not invalidate due to a change in clientData$output_distPlot_width or `clientData$output_distPlot_height.

1 Like

Ah duh!! Thanks @barret ! It might be helpful to add that to the documentation page/legend? Just a suggestion -- thanks again!

1 Like

This topic was automatically closed 7 days after the last reply. New replies are no longer allowed.