Dear All,
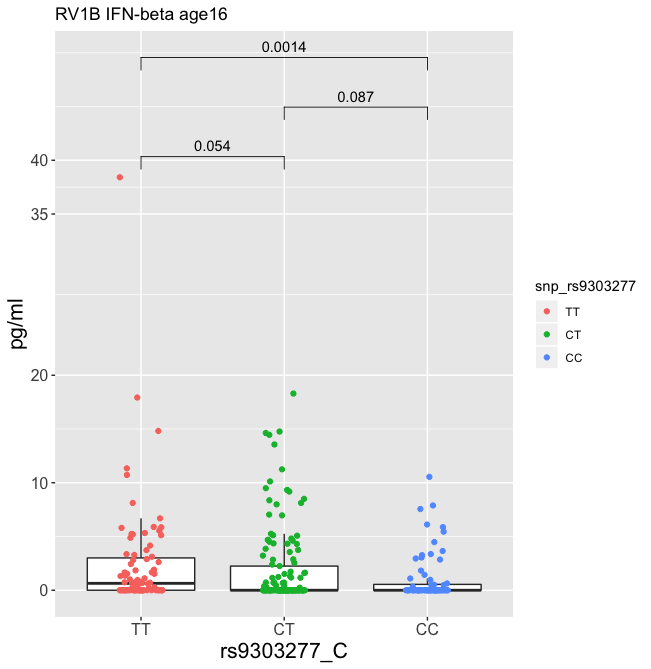
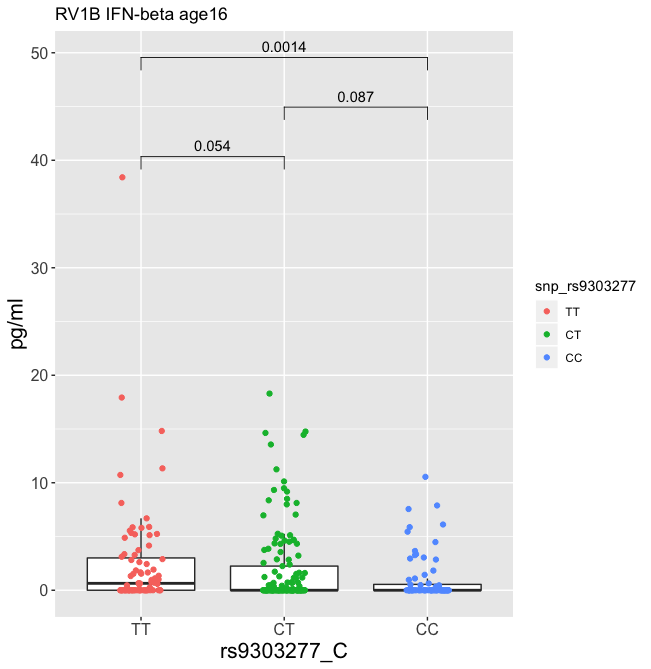
I'm trying to cut unnecessary part of y axis from my ggplot2 please see code below:
snp_rs9303277<-as.factor(age16_RV_SNP_Rawdata$rs9303277_C)
levels(snp_rs9303277)<-c("TT","CT","CC")
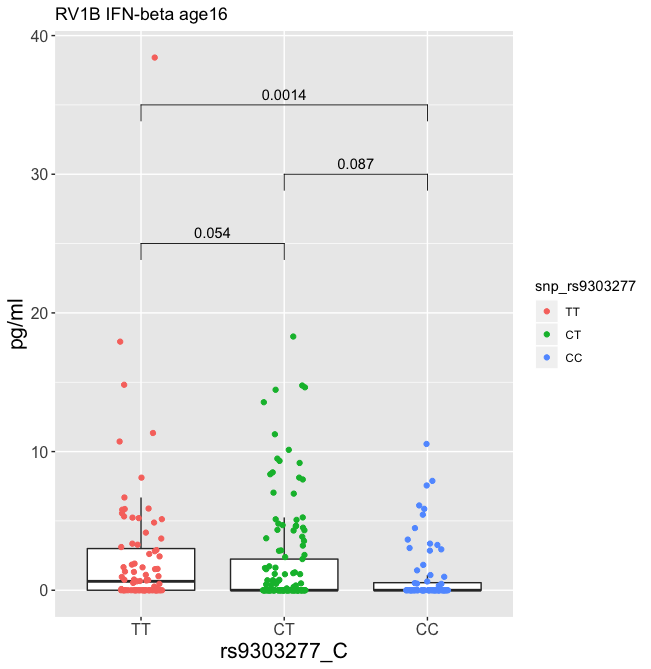
p1<-ggplot(aes(x=as.factor(rs9303277_C),y=IFN_beta_RV1B),data = age16_RV_SNP_Rawdata)+theme(axis.text.y=element_text(size = 12),axis.text.x = element_text(size = 12),axis.title = element_text(size = 16))+geom_boxplot(outlier.size = -1)+xlab("rs9303277_C")+ylab("pg/ml")+ ggtitle("RV1B IFN-beta age16")+
scale_x_discrete(labels=c("0" = "TT", "1" = "CT", "2" = "CC"))
A1<-p1+stat_compare_means(comparisons = my_comperisons)+ scale_y_continuous(breaks=c(0,10,20,35,40), labels=c(0,10,20,35,40))+
geom_jitter(position = position_jitter(0.15),aes(color=snp_rs9303277))
A1
I'm trying to remove y scale from 20 to 35 pg/ml, but instead I achieved to just put the breaks were I needed them. please see attached. any ideas how can I remove unwanted part of Y axis?
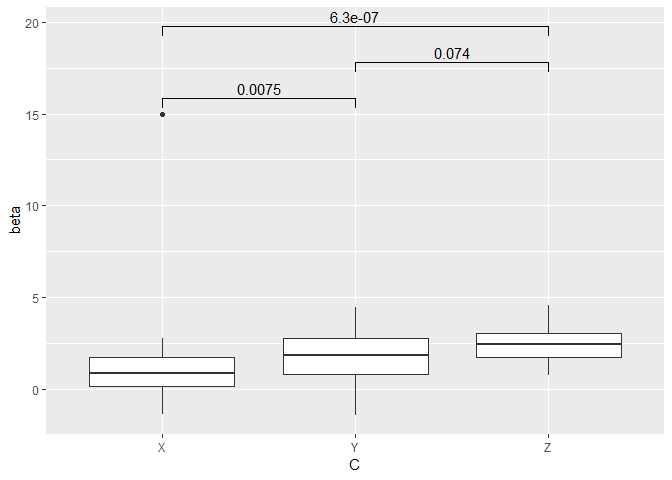
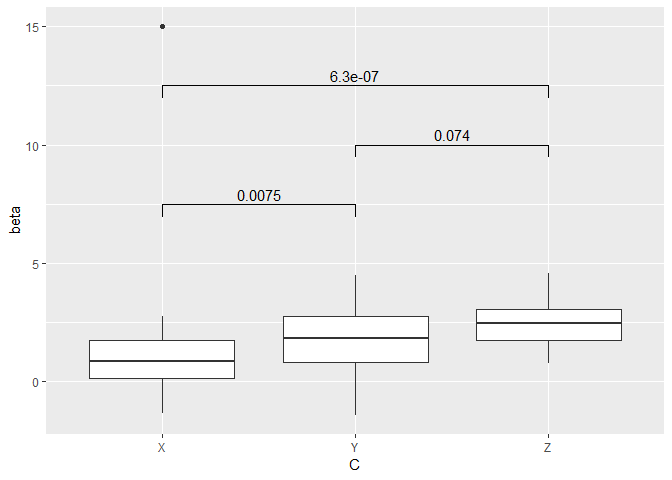
Rather than cutting out part of the y axis, which would make the plot hard to interpret, could you move the mean comparisons. Compare the two plots below.
library(ggplot2)
library(ggpubr)
#> Warning: package 'ggpubr' was built under R version 3.5.3
#> Loading required package: magrittr

Rawdat <- data.frame(C = rep(c("X", "Y", "Z"), each = 31),
                     beta = c(c(rnorm(30, 1,1), 15), rnorm(31, 2,1.5), rnorm(31, 2.5, 1)))
p1<-ggplot(data = Rawdat, aes(x = C, y= beta)) + geom_boxplot()

p1 + stat_compare_means(comparisons = list(c("X", "Y"), c("Y", "Z"), c("X", "Z")))
I would expect that to cause an error so I assume your actual code did not have that problem. If the problem continues after fixing the typo, please show the result of these two commands.
ggplot(aes(x = rs9303277_C, y = IFN_beta_RV1B), data=age16_RV_SNP_Rawdata) +
  geom_boxplot()