Hi there!
I have a problem, in my graph, I have a value that is very high...
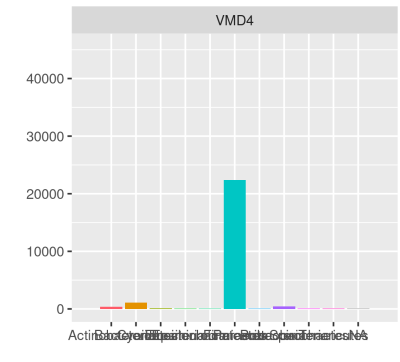
but when I zoom out my graph, I have also smaller values that I want to keep.
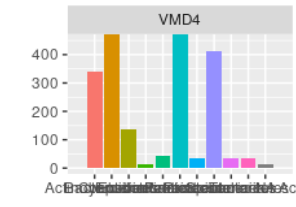
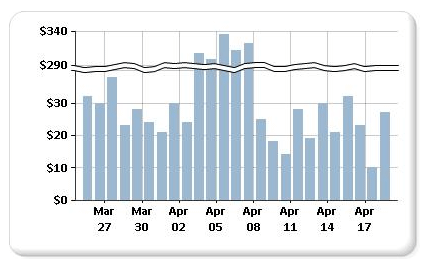
I would like to be able to keep all the data and so what I would like to do is cut the y axis like this:
is it possible on ggplot ?
Here is my code ![]()
ggplot(Phylum_df) +
  geom_bar(aes(x = Phylum, fill = Phylum)) +
  facet_wrap(~Family) +
  coord_cartesian( xlim = c(0, 12), ylim = c(0, 450))
Thanks