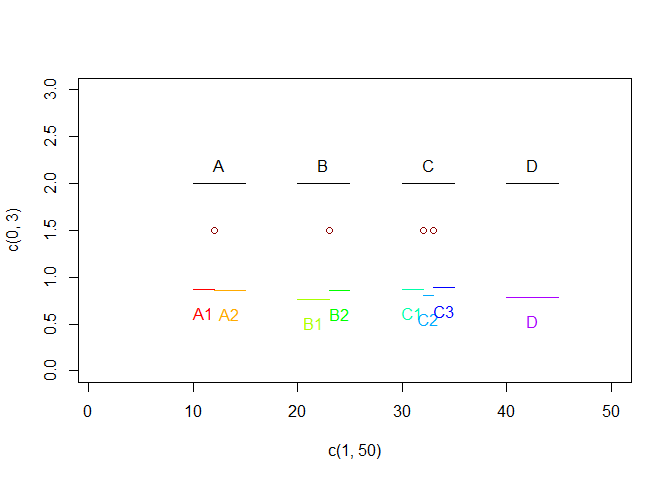
I have a data frame that contains ranges (defined by their start and end), and a second data frame that contains cut points. There can be 0, 1, or several cut points within each range. Whenever a cut point falls within a range, I want to separate that range in two rows, using the cut point as end and start of the new rows.
Illustration with fake data:
suppressPackageStartupMessages(library(tidyverse))

source_df <- tibble(id = LETTERS[1:4],
                    start = as.integer(10*(1:4)),
                    end = as.integer(10*(1:4)+5))

cutting_df <- tibble(cutpoint = c(12L, 23L, 32L,33L))


expected_result <- tibble(id    = c("A1","A2","B1","B2","C1","C2","C3","D"),
                          start = c( 10L, 12L, 20L, 23L, 30L, 32L, 33L, 40L),
                          end   = c( 12L, 15L, 23L, 25L, 32L, 33L, 35L, 45L))

source_df
#> # A tibble: 4 x 3
#>   id    start   end
#>   <chr> <int> <int>
#> 1 A        10    15
#> 2 B        20    25
#> 3 C        30    35
#> 4 D        40    45
cutting_df
#> # A tibble: 4 x 1
#>   cutpoint
#>      <int>
#> 1       12
#> 2       23
#> 3       32
#> 4       33
expected_result
#> # A tibble: 8 x 3
#>   id    start   end
#>   <chr> <int> <int>
#> 1 A1       10    12
#> 2 A2       12    15
#> 3 B1       20    23
#> 4 B2       23    25
#> 5 C1       30    32
#> 6 C2       32    33
#> 7 C3       33    35
#> 8 D        40    45

plot(c(1,50), c(0,3), col="white")
for(i in seq_len(nrow(source_df))){
  lines(c(source_df[i, "start"], source_df[i, "end"]), c(2,2))
  text((source_df[i, "end"]-source_df[i, "start"])/2 + source_df[i, "start"], 2.2, source_df[i, "id"])
}
for(i in seq_len(nrow(cutting_df))){
  points(cutting_df$cutpoint[i], 1.5, col = "darkred")
}
for(i in seq_len(nrow(expected_result))){
  jitter <- runif(1,max = .2)
  lines(x = c(expected_result[i, "start"], expected_result[i, "end"]),
        y = c(.75,.75) + jitter,
        col = rainbow(9)[i])
  text(x = (expected_result[i, "end"]-expected_result[i, "start"])/2 + expected_result[i, "start"],
       y = .5+jitter,
       labels = expected_result[i, "id"],
       col = rainbow(9)[i])
}

The numbers are guaranteed to be all integers, my data frames have at least 10s of thousands, potentially millions of rows, so performance is a concern.
I feel like there should be a dplyr/tidyverse solution, but I can't figure it out.
Side note: actually, the real data is genomic coordinates, so I'm also exploring IRanges/GRanges solutions. But in that case too, I can't come up with an approach that doesn't require looping over the data frames several times. And since I'm doing the other analyses with the tidyverse, a dplyr solution would be more elegant.