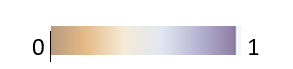
I would like to customized the legend.
ie min(z) color palette max(z) as it shown in the attached picture.
library(leaflet)
library(tidyverse)
set.seed(1)
df <- local({
  n <- 300; x <- rnorm(n); y <- rnorm(n)
  z <- sqrt(x ^ 2 + y ^ 2); z[sample(n, 10)] <- NA
  data.frame(x, y, z)
})
pal <- colorNumeric("OrRd", df$z)
leaflet(df) %>%
  addTiles() %>%
  addCircleMarkers(~x, ~y, color = ~pal(z), group = "circles") %>%
  addLegend(pal = pal, values = ~z, group = "circles", position = "bottomleft") %>%
  addLayersControl(overlayGroups = c("circles"))