Hi all,
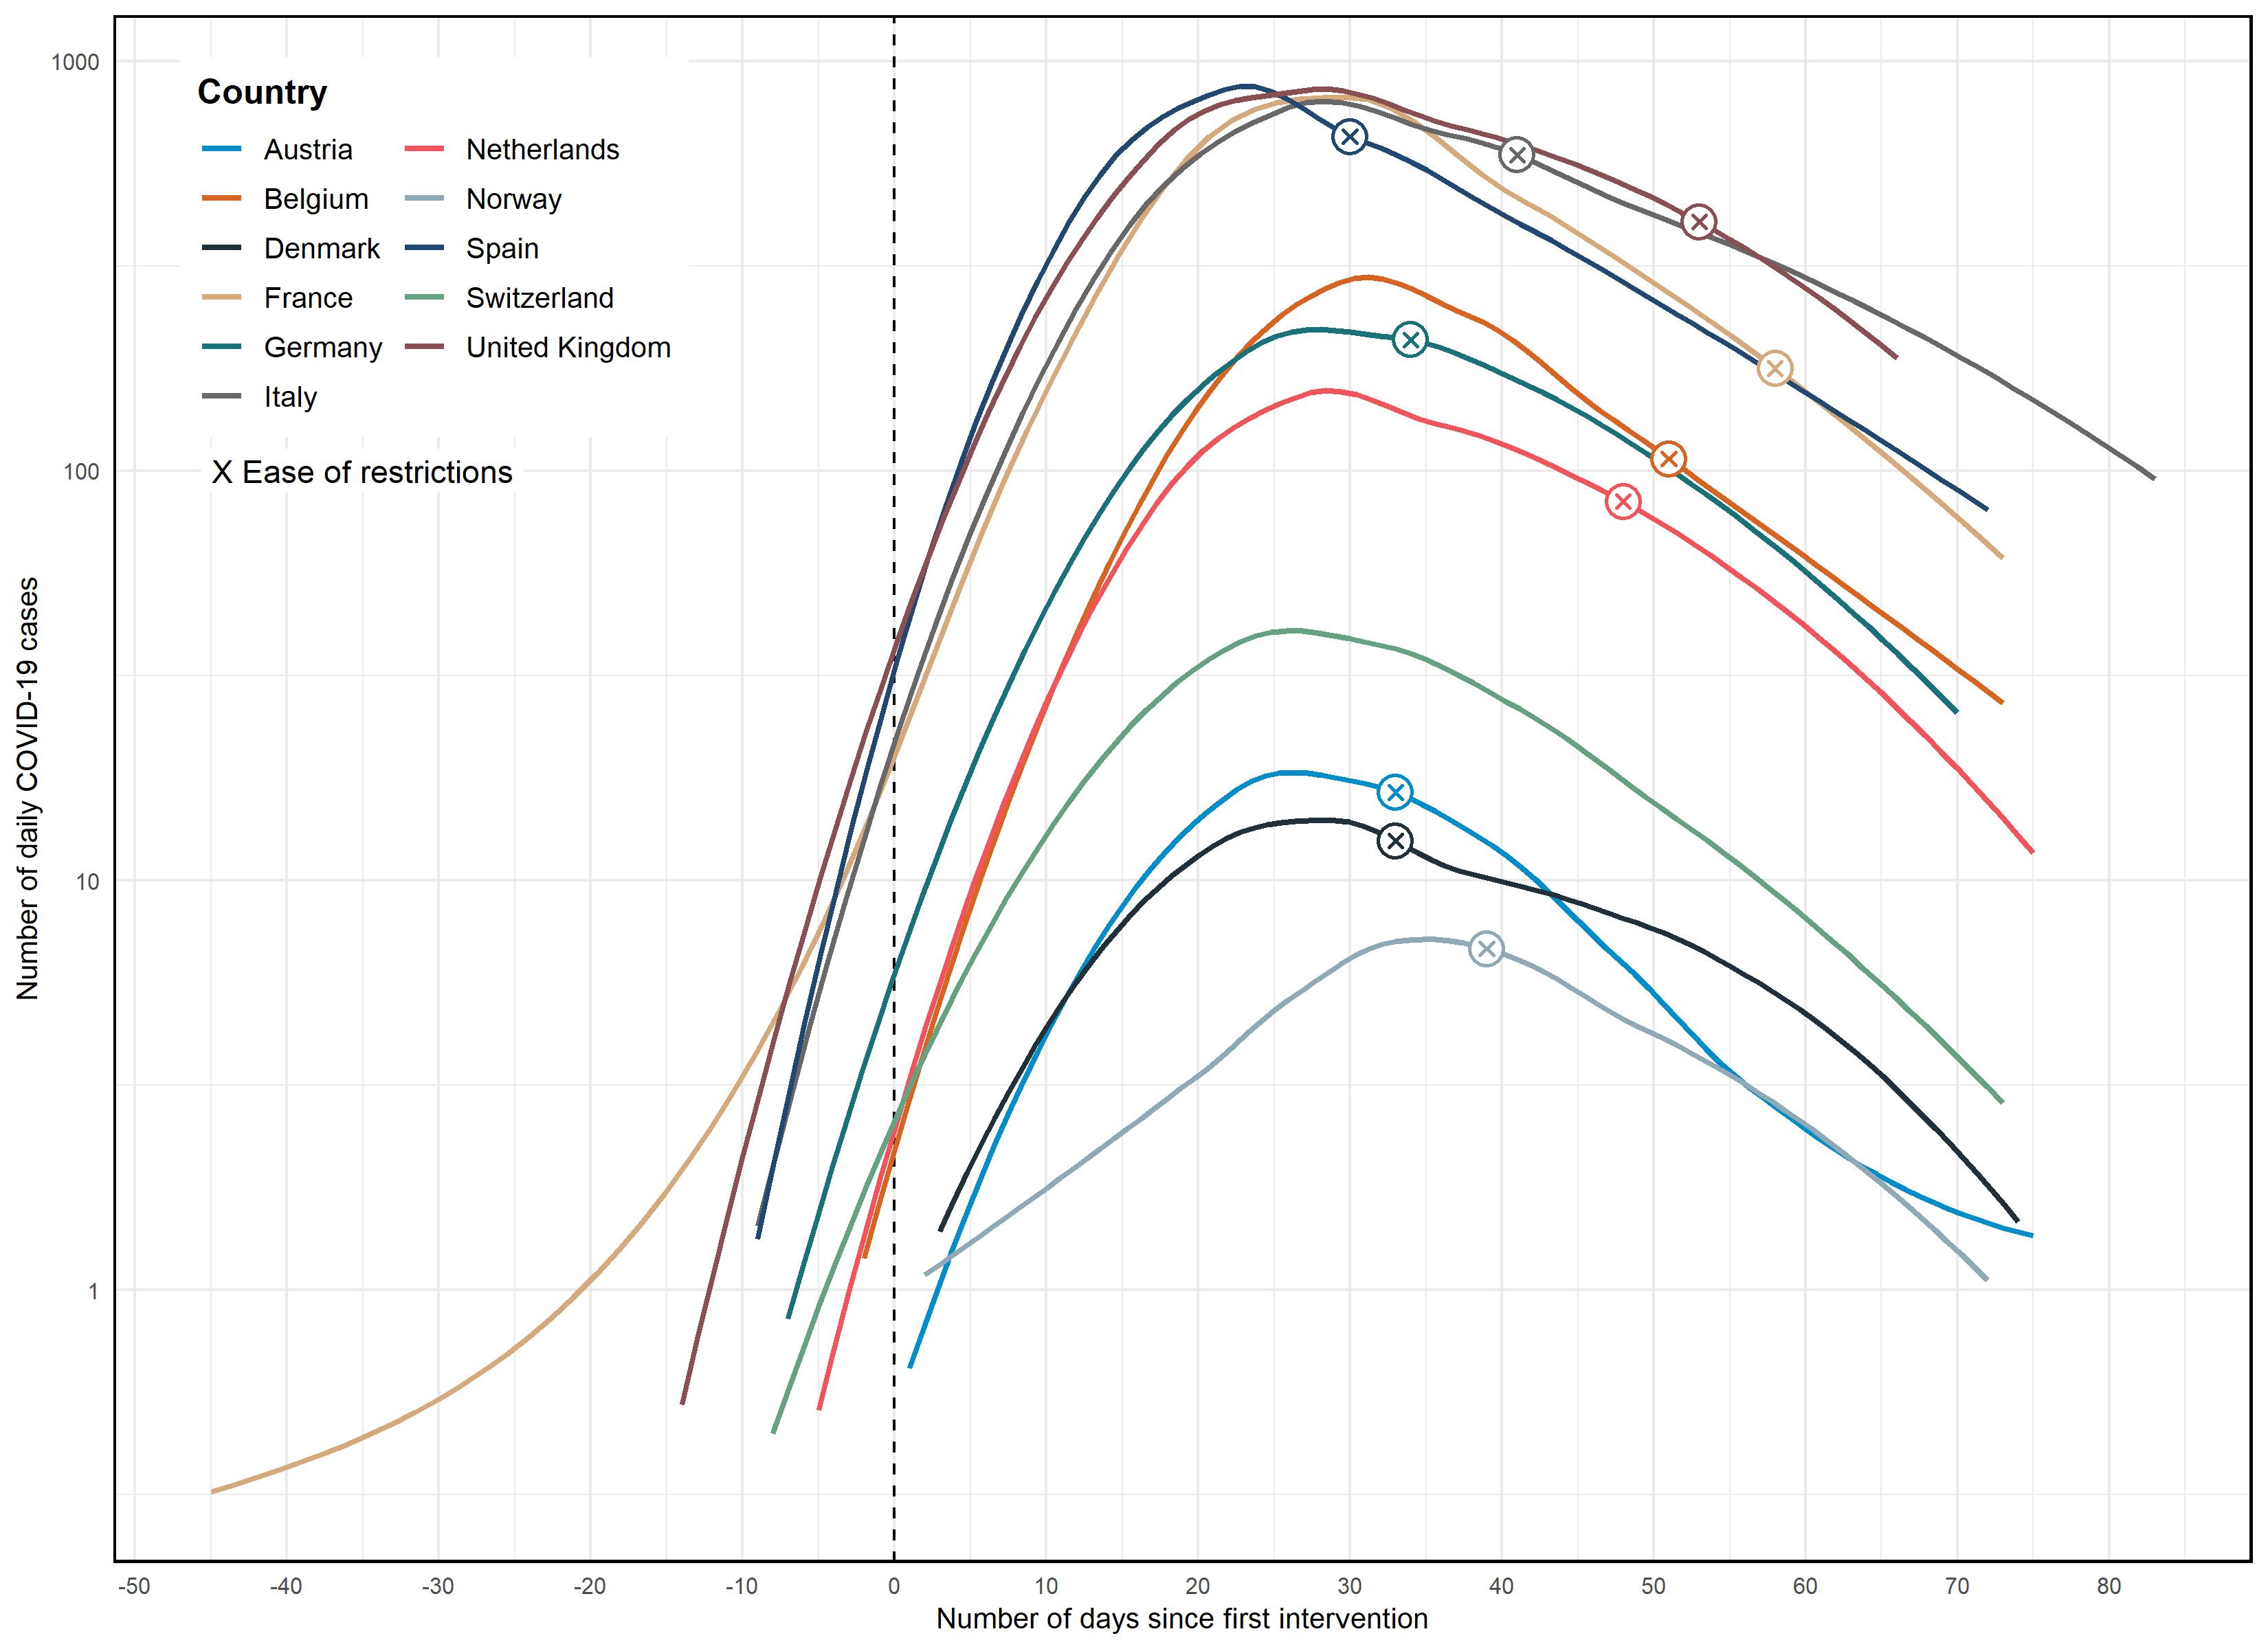
I'm would like to add to my legend the marker that you can see on each curve (but only once, not on all lines in my legend).
I tried to "hide" a geom_points layer (only one color, not grouped,colored by ADM0NAME) behind my actual points, thinking it would appear isolated in the legend but it doesn't work, the point marker legend keeps coming on top of my lines in my legend.
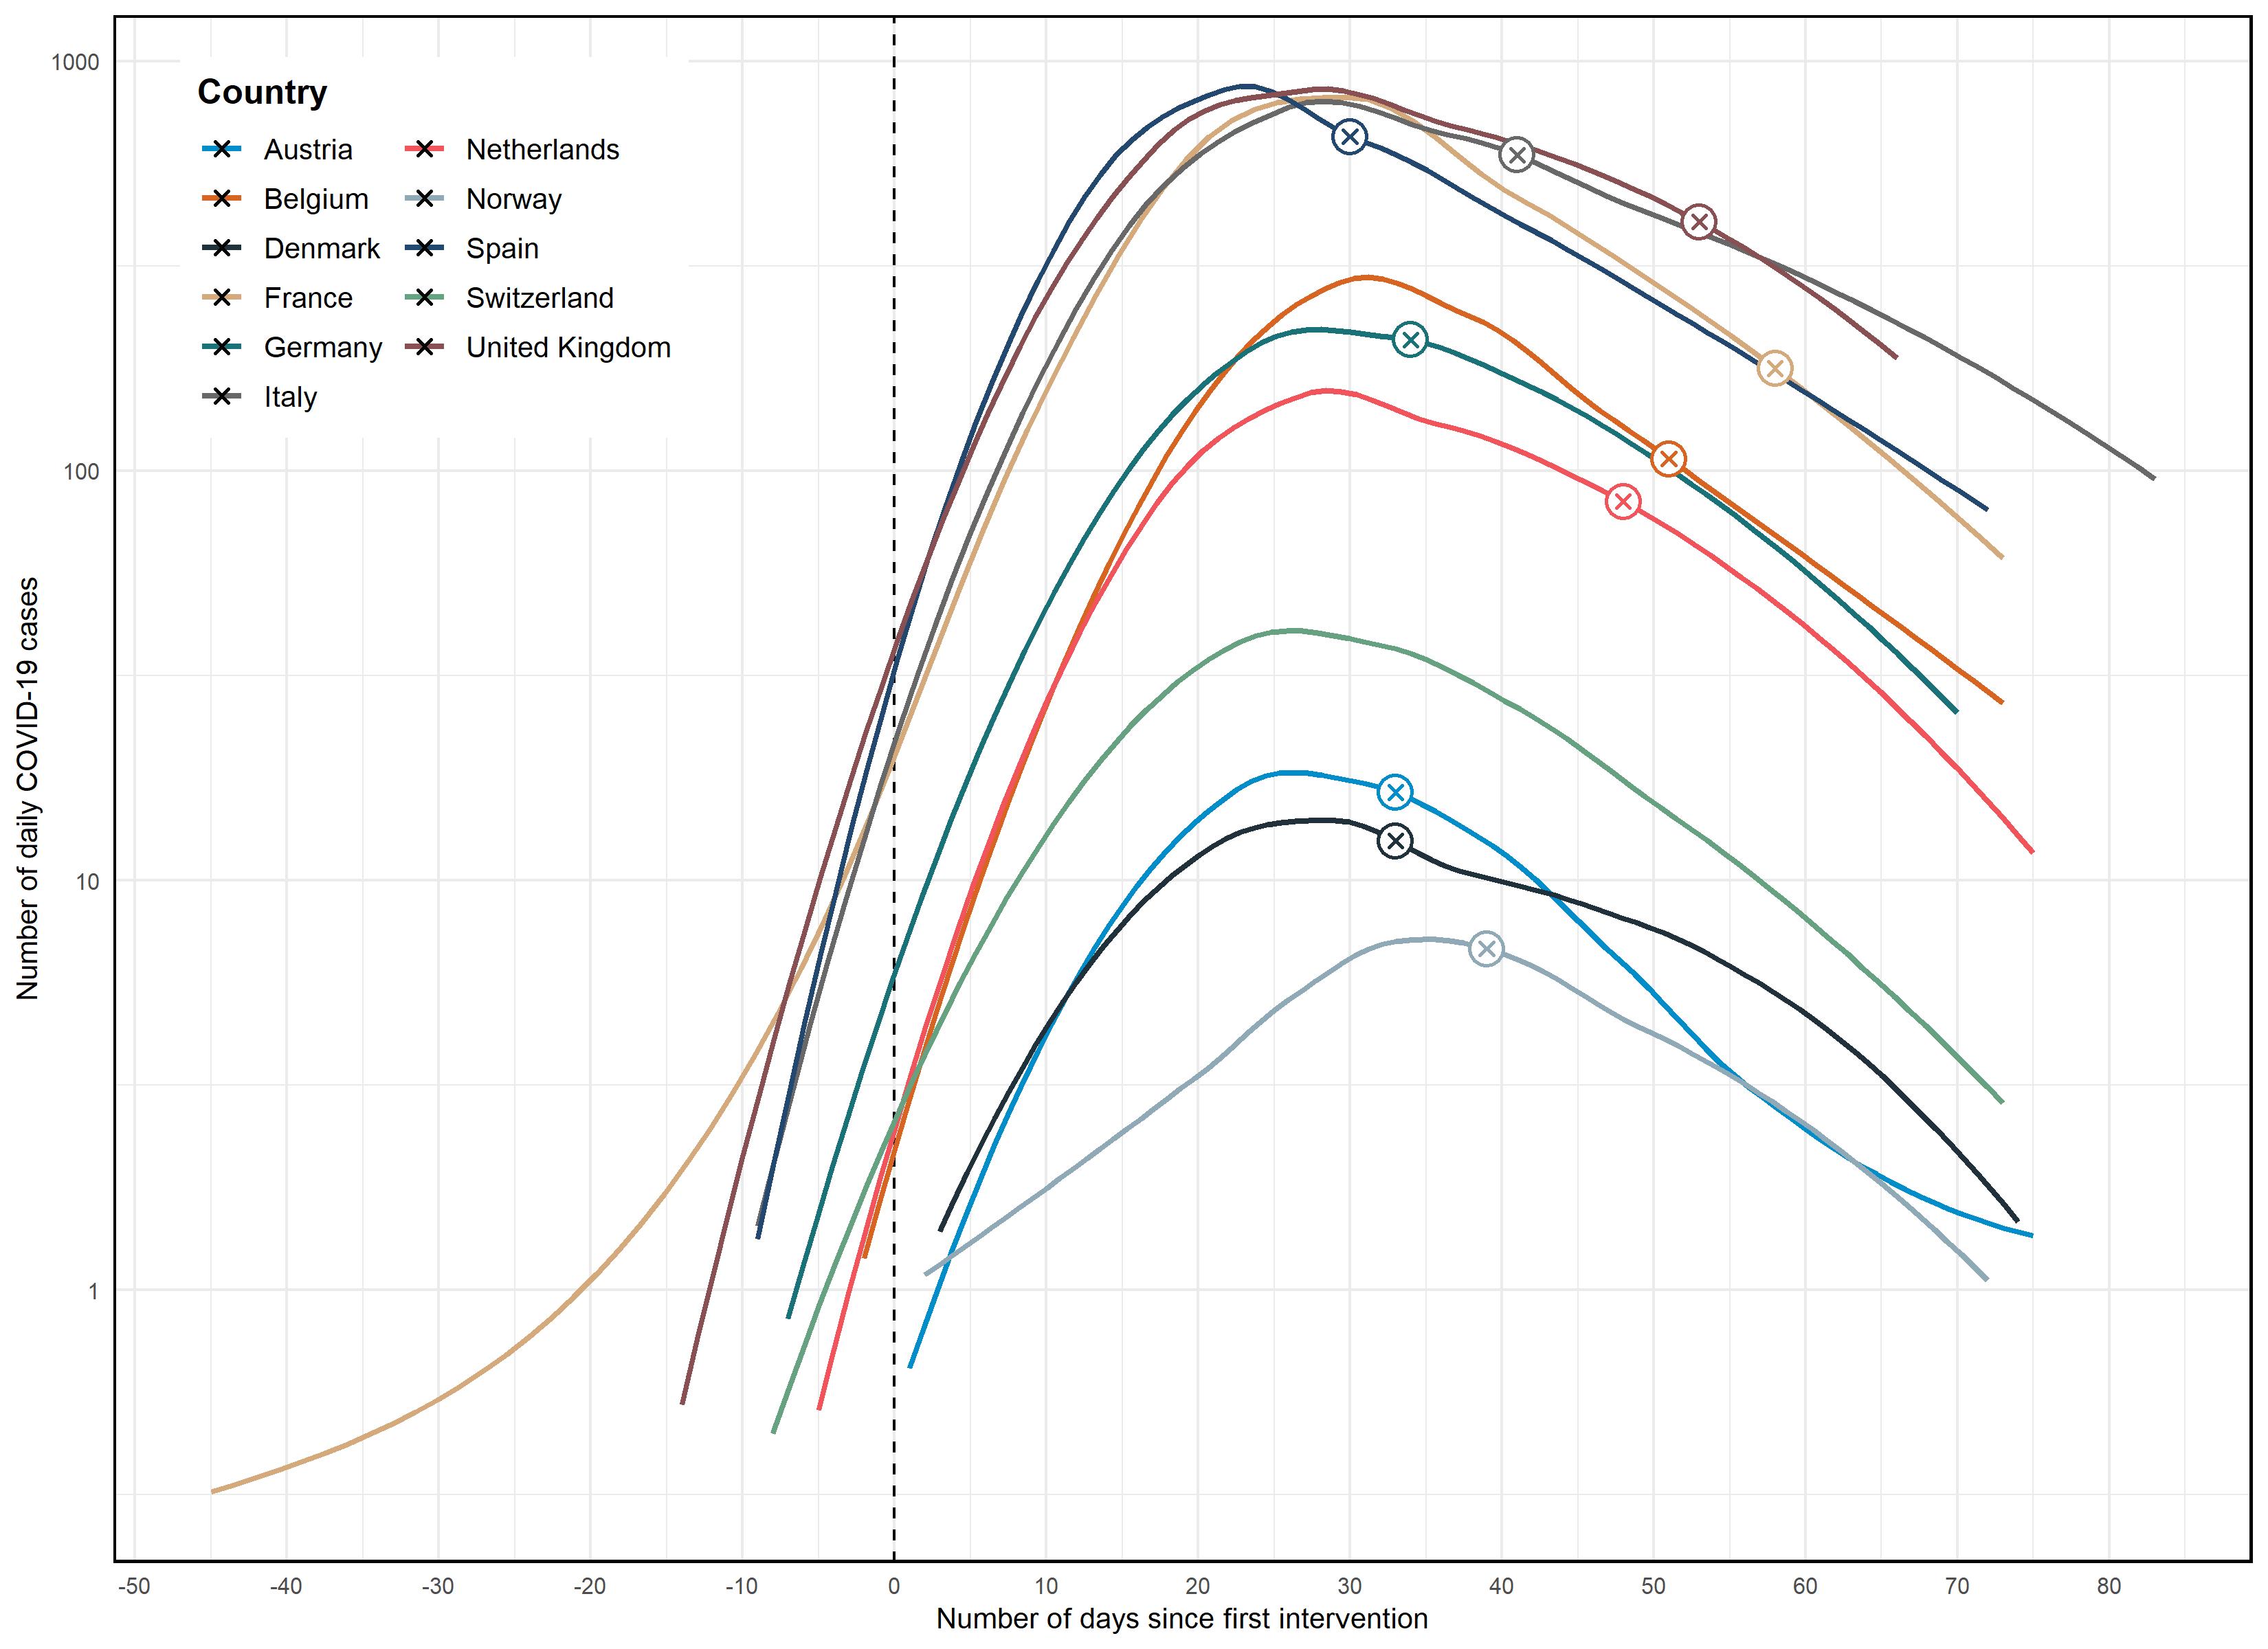
DeathsAgainstFirstMeasure|687x500
plot_deaths<-ggplot()+
  geom_vline(xintercept = 0,linetype="dashed")+theme_minimal()+theme(text = element_text(size = 10),legend.text=element_text(size=10),legend.title=element_text(size=12,face="bold"),axis.title = element_text(size=10))+
  labs(x="Number of days since first intervention",y="Number of daily COVID-19 cases",color="Country")+
  geom_smooth(data=DatasetForDeaths,aes(x=DaysDifference,y=logvalueDeaths,group=ADM0NAME,color=ADM0NAME),se=FALSE)+
  #geom_point(data=DatasetEaseDates_Deaths,aes(x=DaysDifference,y=SmoothedValueDeaths),shape=4,stroke=1,show.legend=TRUE)+
  geom_point(data=DatasetEaseDates_Deaths,aes(x=DaysDifference,y=SmoothedValueDeaths,group=ADM0NAME,color=ADM0NAME),shape=21,fill="white",size=5,stroke=1,show.legend=FALSE)+
  geom_point(data=DatasetEaseDates_Deaths,aes(x=DaysDifference,y=SmoothedValueDeaths,group=ADM0NAME,color=ADM0NAME),shape=4,stroke=1,show.legend=FALSE)+
  scale_color_manual(values=MyPalette)+
  scale_x_continuous(breaks=seq(-50,100,10))+
  scale_y_continuous(labels=function(x) round(10^x))+
  theme(legend.position = c(0.15, 0.85),
        legend.background = element_rect(fill='white',color='white'),
        panel.border = element_rect(colour = "black", fill=NA, size=1))+
  guides(color=guide_legend(ncol=2))