Customise time points on distribution histogram

Hi all,
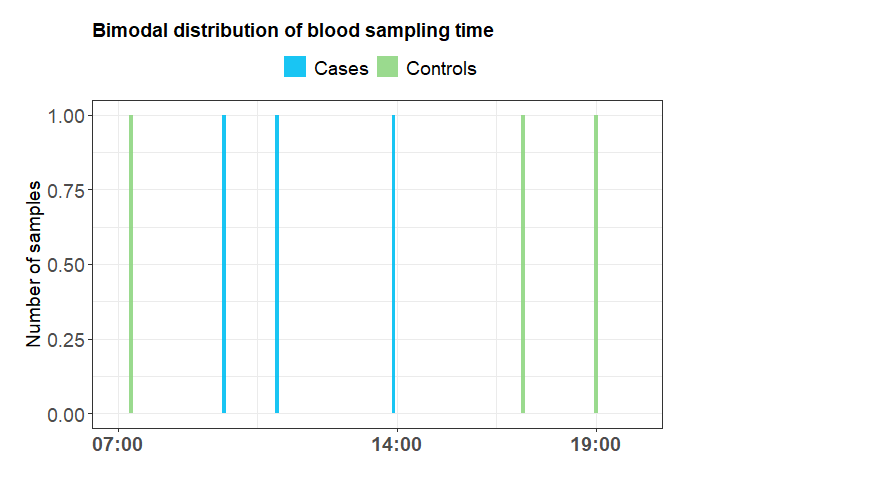
I have made a distribution of blood sampling times, and would like to use only three time points on the x-axis, 07:00, 14:00 and 19:00.

One problem I have is that I do not have a sample for 07:00. The first starts at 07:20. I have tried scale_x_time() without luck. Also, I would like to remove the seconds from the hms formatted time. No luck there either.

Thanks for your help.


plot <- targets2 %>%
  ggplot(aes(x=Blood_draw_time, fill = factor(Case_Control))) +
  geom_histogram(binwidth = 300, alpha = 0.9) +
  ggtitle("Bimodal distribution of blood sampling time") +
  theme_bw() +
  labs(x = " ", y = "Number of samples") +
  scale_fill_manual(values = c("#00bff2","#8fd682")) +
  theme(
    plot.title = element_text(face = "bold", size = 14),
    legend.position = "top",
    legend.title = element_blank(),
    legend.text = element_text(size = 14),
    axis.text.x = element_text(size = 14, face = "bold"),
    axis.text.y = element_text(size = 14),
    axis.title.y = element_text(size = 14),
    plot.margin = margin(t=12, r = 14, b = 10, l = 12, unit = "pt")
    )

plot 

Bit of data

targets2 %>% 
  head() %>% tibble::tribble(
               ~Case_Control, ~Blood_draw_time,
                  "Controls",       "07:20:00",
                  "Controls",       "17:10:00",
                  "Controls",       "19:00:00",
                     "Cases",       "11:00:00",
                     "Cases",       "13:57:00",
                     "Cases",       "09:40:00"
               )

  dpasta()

Below is one way to address your questions. First, Blood_draw_time was changed from character to time using as_hms() from the hms package. Then, scale_x_time() was used to expand the limits of the plot (to include 07:00:00), set the desired values using breaks, and format the labels using parse_date_time() from the lubridate package.

library(tidyverse)
library(hms)
library(lubridate)

targets2 = tibble::tribble(
    ~Case_Control, ~Blood_draw_time,
    "Controls",       "07:20:00",
    "Controls",       "17:10:00",
    "Controls",       "19:00:00",
    "Cases",       "11:00:00",
    "Cases",       "13:57:00",
    "Cases",       "09:40:00"
  ) 

plot <- targets2 %>%
  # change character to time
  mutate(Blood_draw_time = as_hms(Blood_draw_time)) %>%
  ggplot(aes(x=Blood_draw_time, fill = factor(Case_Control))) +
  geom_histogram(binwidth = 300, alpha = 0.9) +
  ggtitle("Bimodal distribution of blood sampling time") +
  theme_bw() +
  labs(x = " ", y = "Number of samples") +
  # expand limits; set breaks; label and format breaks
  scale_x_time(limits = c(as_hms('07:00:00'), as_hms('20:00:00')),
               breaks = c(as_hms('07:00:00'), as_hms('14:00:00'), as_hms('19:00:00')),
               labels = format(parse_date_time(c(as_hms('07:00:00'), as_hms('14:00:00'), as_hms('19:00:00')),
                                               orders = c('HMS', 'HM')
                                               ), 
                               '%H:%M')
               ) +
  scale_fill_manual(values = c("#00bff2","#8fd682")) +
  theme(
    plot.title = element_text(face = "bold", size = 14),
    legend.position = "top",
    legend.title = element_blank(),
    legend.text = element_text(size = 14),
    axis.text.x = element_text(size = 14, face = "bold"),
    axis.text.y = element_text(size = 14),
    axis.title.y = element_text(size = 14),
    plot.margin = margin(t=12, r = 14, b = 10, l = 12, unit = "pt")
  )

plot

Created on 2022-10-03 with reprex v2.0.2.9000

1 Like

@scottyd22 Super great, thank you! I see my error was that I wrote the breaks argument incorrectly.

This topic was automatically closed 7 days after the last reply. New replies are no longer allowed.

If you have a query related to it or one of the replies, start a new topic and refer back with a link.