I've tried to make a plot with the mean specified with a legend and a line at the mean. I used geom_tile but I want the legend key to look like a line. I don't want a line connecting each group. I tried to specify the key_glyph but it's not working for geom_tile and it's just blank.
library(ggplot2)
# baseplot
p <-
ggplot(iris, aes(Species, Sepal.Length)) +
geom_dotplot(binwidth=.12, dotsize = .5, binaxis = "y", stackdir='center') +
# these are both here to accommodate all examples
scale_fill_manual(NULL, values = c(Mean="red")) +
scale_color_manual(NULL, values = c(Mean="red")) +
theme_bw()
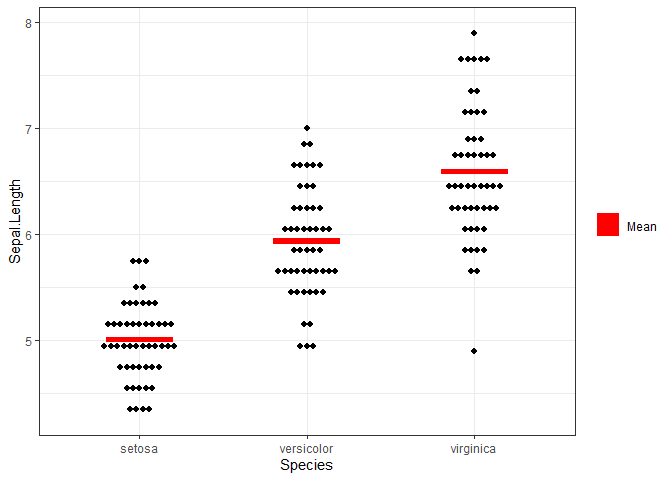
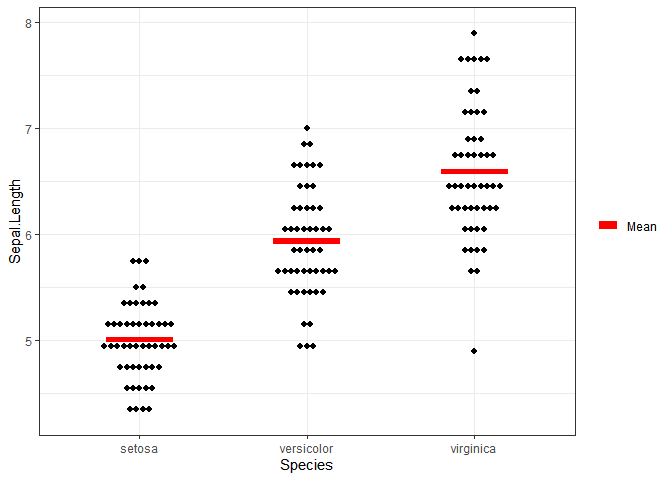
# I want this graph
p + geom_tile(aes(width=.4, height=.05, fill="Mean"), stat = "summary", fun= mean)
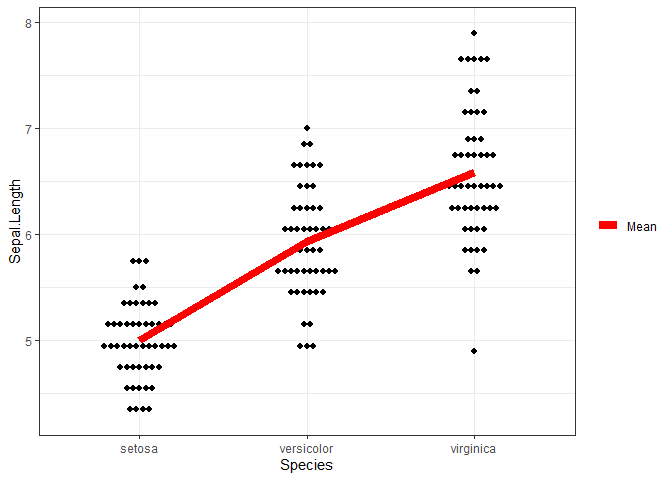
# I want this legend
p + geom_line(aes(group=1, color="Mean"), size=3, stat = "summary", fun=mean,
              key_glyph = draw_key_path) # This is the default
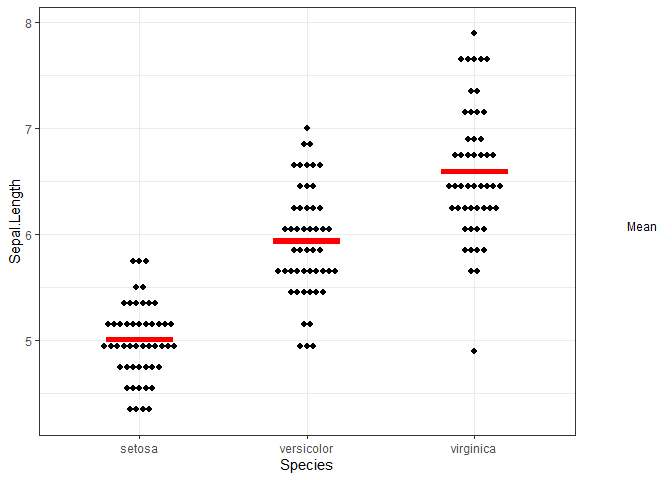
# my failed attempet to copy the key_glyph of geom_line
p + geom_tile(aes(width=.4, height=.05, fill="Mean"), stat = "summary", fun = mean,
              key_glyph = draw_key_path)
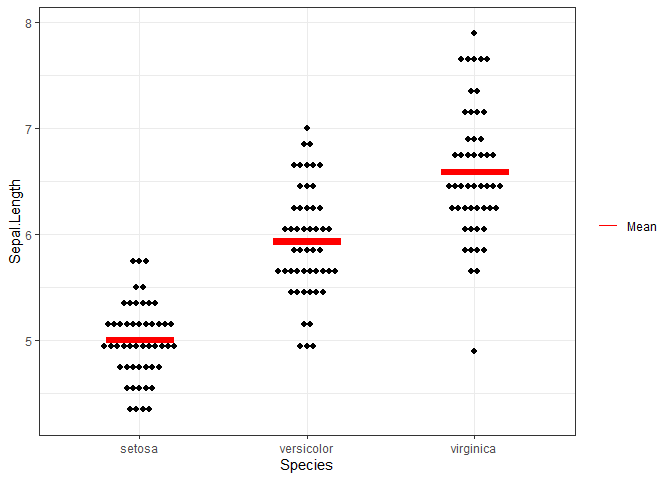
The problem seems to be that to use the path glyph you have to set its color because paths do not have a fill.
library(ggplot2)

p <-
  ggplot(iris, aes(Species, Sepal.Length)) +
  geom_dotplot(binwidth=.12, dotsize = .5, binaxis = "y", stackdir='center') +
  # these are both here to accommodate all examples
  scale_fill_manual(NULL, values = c(Mean="red")) +
  scale_color_manual(NULL, values = c(Mean="red")) +
  theme_bw()
p + geom_tile(aes(width=.4, height=.05, color = "Mean", fill = "Mean"), stat = "summary", fun = mean,
              key_glyph = draw_key_path)
After I posted I looked into modifying the size of the line and it can be done. There is an interaction with the height setting in the geom_tile. As you increase the size you have to decrease the height. The displayed height of the tile seems to be close to height * size.
p + geom_tile(aes(width=.4, height=.025, color = "Mean", fill = "Mean"), size = 2,
              stat = "summary", fun = mean,
              key_glyph = draw_key_path)