I've created a custom heatmap for counts of deaths in political violence project using kableExtra tools and rendering to html. However, I want to add custom borders to mark off different presidential administrations. The only border tools seem to be on column_spec() and don't seem to serve this project.
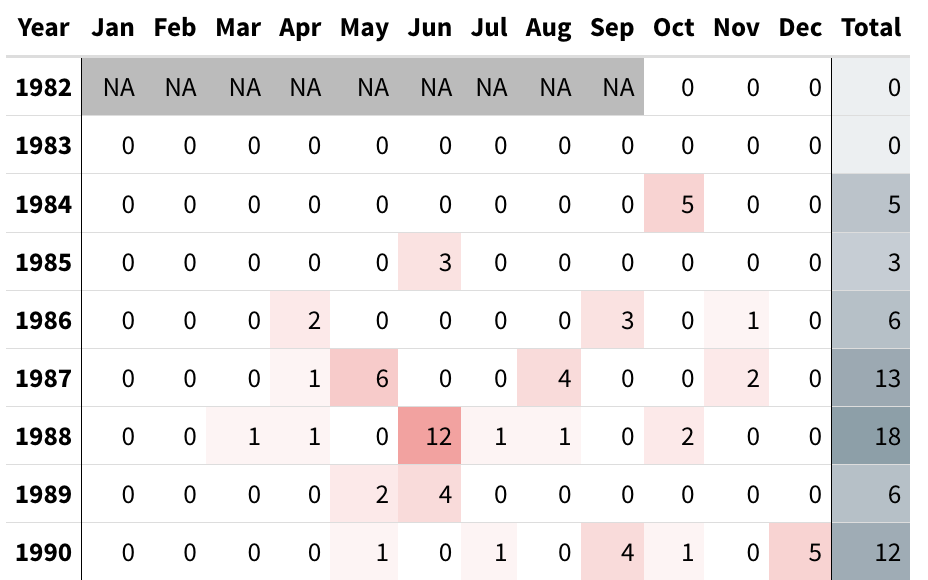
Here's what I have now:
Using this code:
  calendar_tibble %>%
    kable("html") %>%
    kable_styling(bootstrap_options = c("condensed"),
                  full_width = FALSE) %>%
    # Direct call form:
    # column_spec(2,
    #             color = "black",
    #             background = spec_color2(calendar_tibble[,2:13]/max_value,
    #                                     palette = red_pal_wrapper(255))) %>%
    # Look up table form…
    # column_spec(2, color = "black", background = pull(bg_color_map[1])) %>%
    # column_spec(3, color = "black", background = pull(bg_color_map[2])) %>%
    # … to 12
    # Reduce()'d to one line…
    purrr::reduce(2:13, function(acc, col) {
      column_spec(acc, col, color = pull(fg_color_map[col-1]), background = pull(bg_color_map[col-1]))
      }, .init = .) %>%
    column_spec(13, border_right = TRUE) %>%
    {if(ncol(calendar_tibble)>13) column_spec(.,14, color = pull(fg_color_map[13]),
                                              background=pull(bg_color_map[13])) else .} %>%
    column_spec(1, bold=TRUE, border_right=TRUE) %>%
    row_spec(0, align = "c")
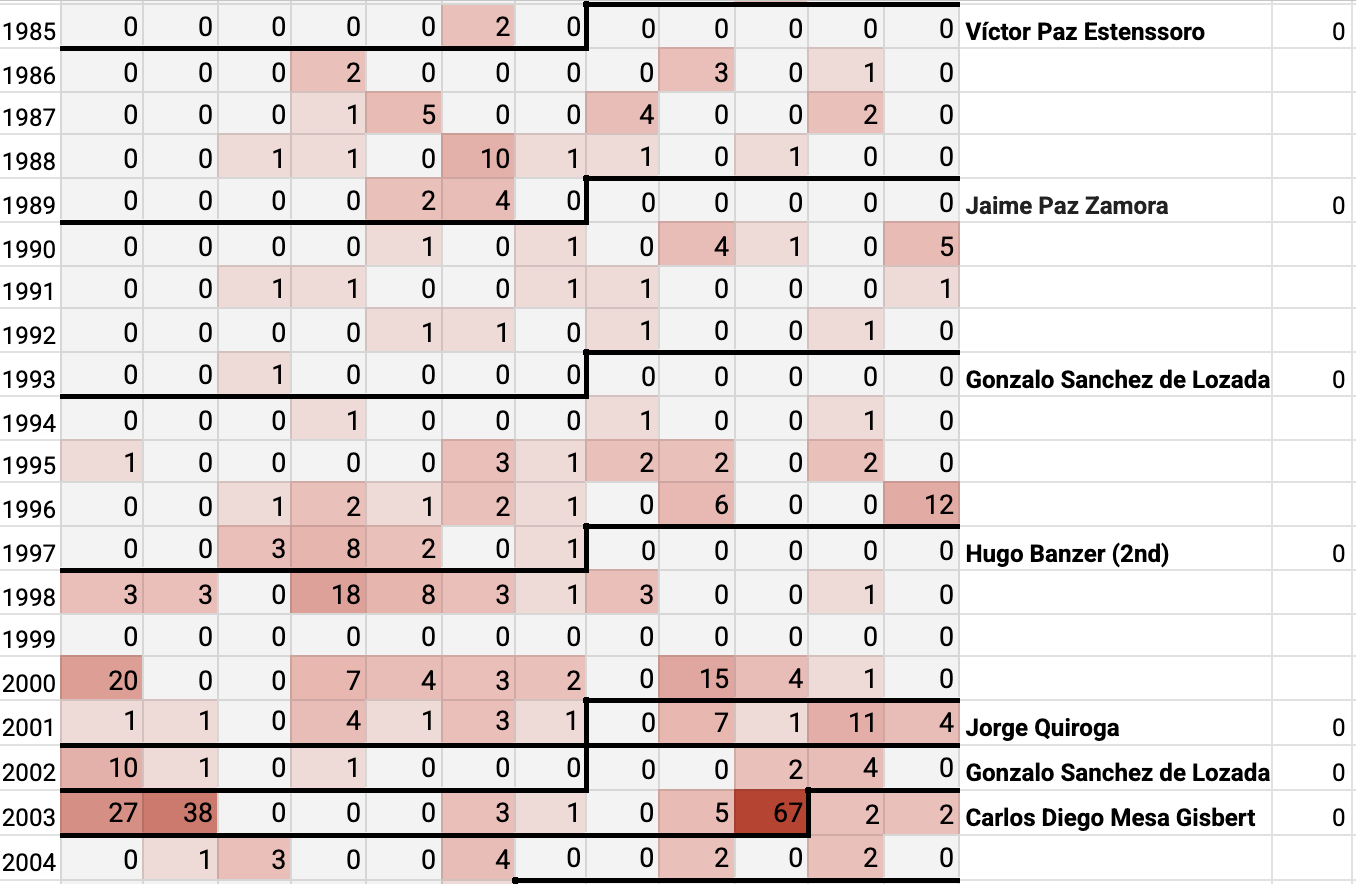
Here's what I want in terms of borders between presidential administration. Note that if row_spec() could add these, I think I can work out the code. This was done by hand in Google Sheets.