Hi All,
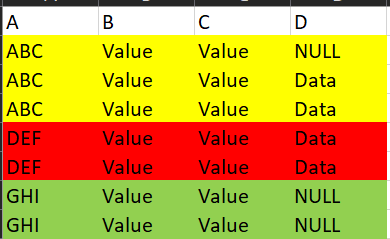
I am trying to show a table with different background based on a particular column value.
So, I want to group by column A and based on that if Column D has NULL value then the background is set accordingly.
Case 1: if it has NULL as well as other values : Color yellow
Case 2: No NULLs (All Data): Color Red
Case: All NULLs: Color Green
I have this code here to achieve this but for some reason the grouping is failing and it takes one single color: Yellow to the whole tables background because it is only checking the count of NULLs based on D column and not grouping by A to do this. Please help!
# DataDFQuery is a sql query which has all the 4 columns as an output

DataDF <- DataDFQuery %>% dplyr::group_by(A)
   functiontocheck <- function(A,D)
    {
      for (u in 2:length(A)) # Looping through all the A
      {
        for (e in 2:length(D)) #Looping through the D within those A
        {
          TotalCount <- length(D) #Length of the error column within the A
          NULLCount <- sum(str_detect(D, '^NULL')) #Length of the "NULL" within the column

          # Assigning the color coding based on these lengths of D
          if (NULLCount == TotalCount)
          {DataTableBackground = 'lightgreen'}
          else if (NULLCount < TotalCount)
          {DataTableBackground = 'lightyellow'}
          else if (NULLCount == 0)
          {DataTableBackground = '#FFCCCB'}

        }
      }
      return(DataTableBackground)
    }

    output$DataDF <- DT::renderDataTable(
      DataDF %>%
        datatable(rownames= FALSE
                  )

        )%>%
        formatStyle(colnames(DataDF), target = 'row', backgroundColor = functiontocheck(A, D))
    )
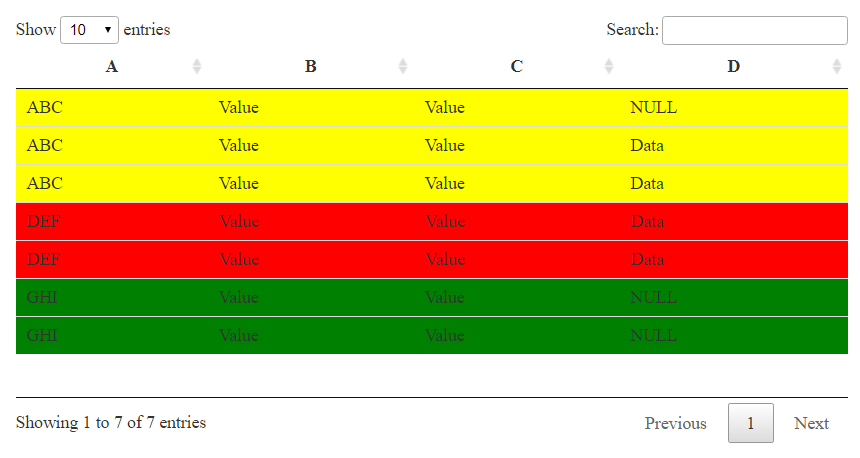
Below is a slightly different approach. First, I use a case_when() statement to create a column in the data frame named color_level. Then, the colors are assigned to backgroundColor using the styleEqual() function, specifying the levels and associated values.
library(dplyr)
library(DT)

DataDFQuery = data.frame(
  A = c(rep('ABC', 3), rep('DEF', 2), rep('GHI', 2)),
  B = 'Value',
  C = 'Value',
  D = c('NULL', rep('Data', 4), 'NULL', 'NULL')
)

DataDFQuery = DataDFQuery %>%
  group_by(A) %>%
  mutate(color_level = case_when(
    all(D == 'Data') ~ 0,
    all(D == 'NULL') ~ 1,
    TRUE ~ 2
  ))

DataDFQuery %>%
  datatable(rownames = FALSE,
            options = list(
              columnDefs = list(list(visible=FALSE, targets = 4)) # hides color_level column
              )
            ) %>%
  formatStyle(columns = 'color_level',
              target = 'row',
              backgroundColor = styleEqual(levels = c(0, 1, 2),
                                           values = c('red', 'green', 'yellow'))
              )
Here is the final output.
@scottyd22 , thank you for the quick reply. However, I trying to do the same thing but assign the table to an output to the UI but it throws an error:
Error in .subset2(x, "impl")$defineOutput: Unexpected datatables object for output$DataDF
ℹ Did you forget to use a render function?
My code:
 output$DataDF <- DataDFQuery %>%
      datatable(rownames = FALSE,
                options = list(
                  columnDefs = list(list(visible=FALSE, targets = 4)) # hides color_level column
                )
      ) %>%
      formatStyle(columns = 'color_level',
                  target = 'row',
                  backgroundColor = styleEqual(levels = c(0, 1, 2),
                                               values = c('red', 'green', 'yellow'))
      )
I overlooked this was for a shiny app. The output should be wrapped in a render function.
output$DataDF <- DT::renderDataTable({
  DataDFQuery %>%
    datatable(rownames = FALSE,
              options = list(
                columnDefs = list(list(visible=FALSE, targets = 4)) # hides color_level column
              )
    ) %>%
    formatStyle(columns = 'color_level',
                target = 'row',
                backgroundColor = styleEqual(levels = c(0, 1, 2),
                                             values = c('red', 'green', 'yellow'))
    )
})
Thank you @scottyd22 this worked 
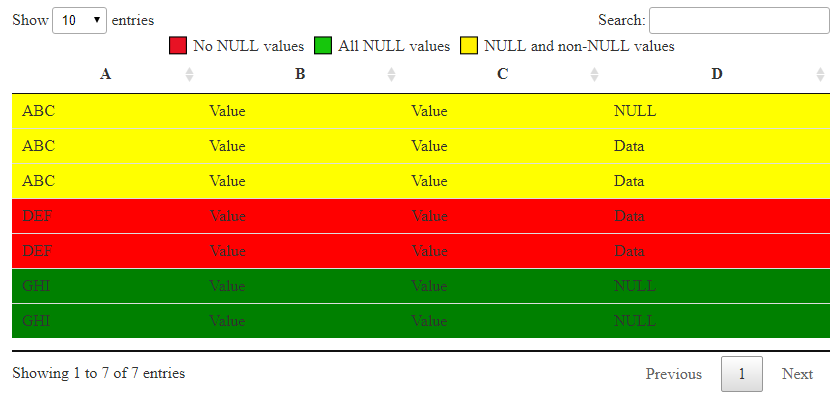
A quick question is there a way to add legend to this table as well? Like if would like to add a small table or box with color coding specification what red, yellow and green mean?
I know there is a way to add legends to plots/graphs. Do you know if it exists for such tables as well?
I'm not aware of any legends that can be added to a table, but you could utilize the table caption (and HTML) to specify what the colors mean. Below is one way to do that.
output$DataDF <- DT::renderDataTable({
Caption = paste0('🟥 No NULL values', # red box
' ', # added space
'🟩 All NULL values', # green box
' ', # added space
'🟨 NULL and non-NULL values</font>' # yellow box
)
DataDFQuery %>%
datatable(rownames = FALSE,
caption = htmltools::HTML(Caption),
options = list(
columnDefs = list(list(visible=FALSE, targets = 4))
)
) %>%
formatStyle(columns = 'color_level',
target = 'row',
backgroundColor = styleEqual(levels = c(0, 1, 2),
values = c('red', 'green', 'yellow'))
)
})
Thanks again @scottyd22 , I believe I might have missed something because if I try another hex code for the colors it stops showing the box and the color on the UI.
Here I used #FFCCCB instead of the red color you mentioned in your example

I should have explained, the color boxes are specific unicode characters. I had to look up the associated HTML entity.
Here is the link I used for yellow: https://www.compart.com/en/unicode/U+1F7E8.
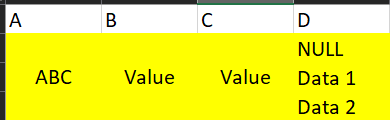
Okay makes sense! @scottyd22, another quick question in the example code is there a way to merge the rows for column for similar values?
Something like this: Column A, B and C have similar values so I want to merge them and then show different values in Column D
I tried doing it with RowsGroup option but does not work
output$DataDF <- DT::renderDataTable({
Caption = paste0('🟥 No NULL values', # red box
' ', # added space
'🟩 All NULL values', # green box
' ', # added space
'🟨 NULL and non-NULL values</font>' # yellow box
)
DataDFQuery %>%
datatable(rownames = FALSE,
caption = htmltools::HTML(Caption),
options = list(
columnDefs = list(list(visible=FALSE, targets = 4)),
options = list(rowsGroup = list(0,1,2)),
extensions = 'RowsGroup'
)
) %>%
formatStyle(columns = 'color_level',
target = 'row',
backgroundColor = styleEqual(levels = c(0, 1, 2),
values = c('red', 'green', 'yellow'))
)
})
I will address this in a different thread, as it is outside the scope of the original topic.