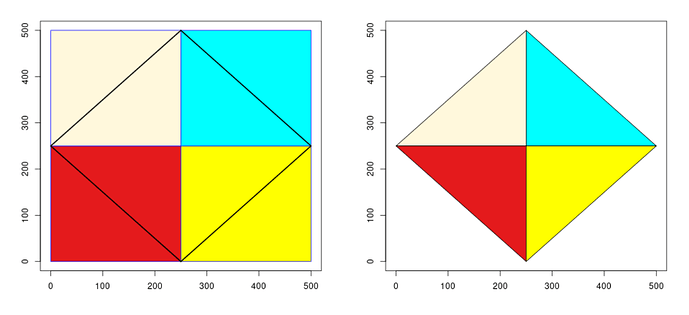
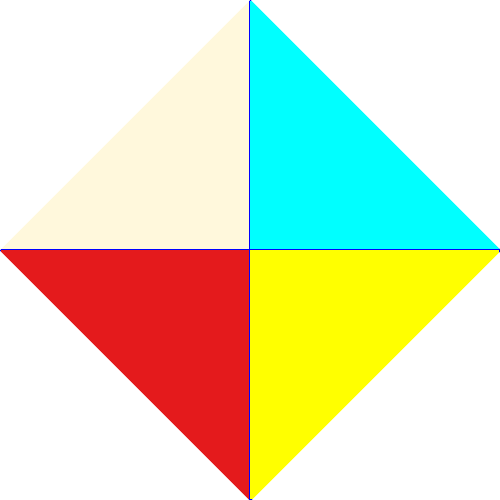
Hi. Suppose I have a plot that is a square containing four colors. Then I inscribe a square that is rotated 45 degrees so that the inscribed square contains those four colors. I want to crop the plot to only plot the inscribed square, with the colors maintained in the same order. I have accomplished this in the following code, but I did this by explicitly describing the colors, so the second plot is not really a crop. Is there a way to do this as more of a crop? In practice I want the original square to be an image, and I want to crop it at four specific points. # rectangle syntax: rect(xleft, ybottom, xright, ytop)
plot(x = c(0, 500), y = c(0, 500), type= "n", xlab = "", ylab = "")
outer square
rect(0, 0, 250, 250, col = "#E41A1C", border = "blue") # bottom left square
rect(250, 0, 500, 250, col = "yellow", border = "blue") # bottom right square
rect(0, 250, 250, 500, col = "cornsilk", border = "blue") # top left square
rect(250, 250, 500, 500, col = "cyan", border = "blue") # top right square
inscribed square
lines(c(0, 250), c(250, 500), col = "black", lwd = 2) # top left diagonal
lines(c(250, 500), c(500, 250), col = "black", lwd = 2) # top right diagonal
lines(c(500, 250), c(250, 0), col = "black", lwd = 2) # bottom right diagonal
lines(c(250, 0), c(0, 250), col = "black", lwd = 2) # bottom left diagonal
cropped inscribed square
plot(x = c(0, 500), y = c(0, 500), type= "n", xlab = "", ylab = "")
polygon(x = c(0, 250, 250, 0), y = c(250, 500, 250, 250), col ="cornsilk")
polygon(x = c(250, 500, 250, 250), y = c(500, 250, 250, 500), col = "cyan")
polygon(x = c(0, 250, 250, 0), y = c(250, 250, 0, 250), col = "#E41A1C")
polygon(x = c(250, 250, 500, 250), y = c(0, 250, 250, 0), col = "yellow")


