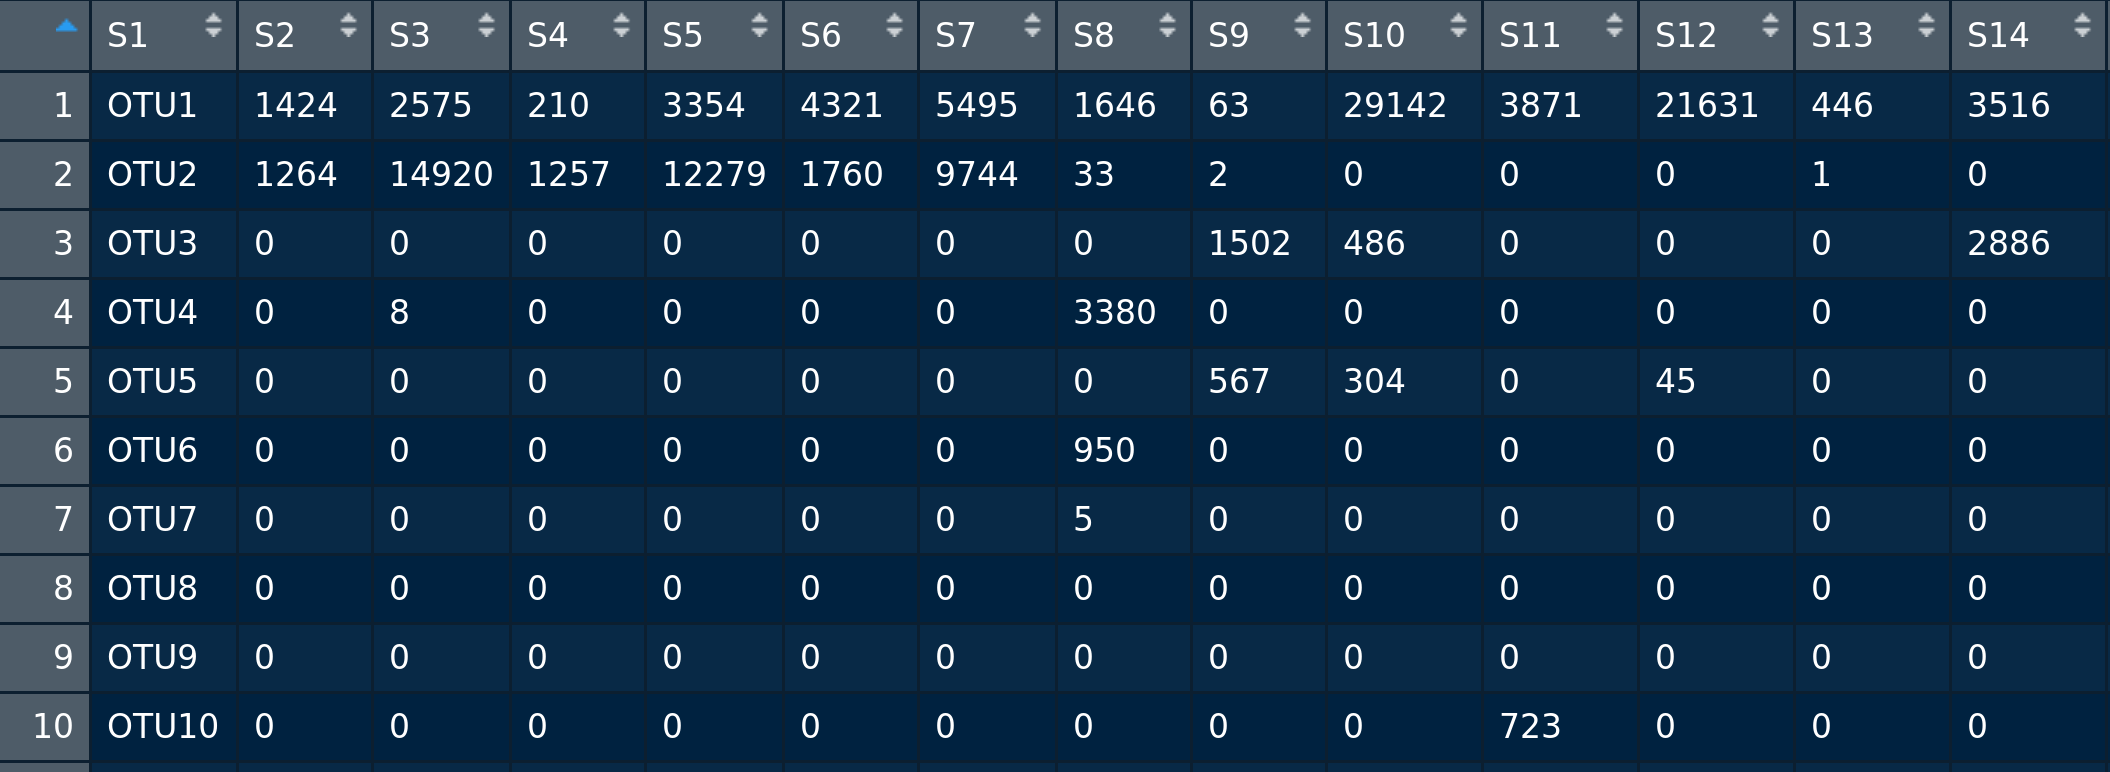
This is my first time working with RStudio and I'm trying to make a bar graph of 32 different samples and 61 data points of different microbe percentages stacked.
I'm having trouble finding a tutorial that can help me graph the 32 samples with the stacked percentages of the microbes. Any help or direction would be greatly appreciated!