Sorry I do not quite understand. Here is some code you can copy and paste.
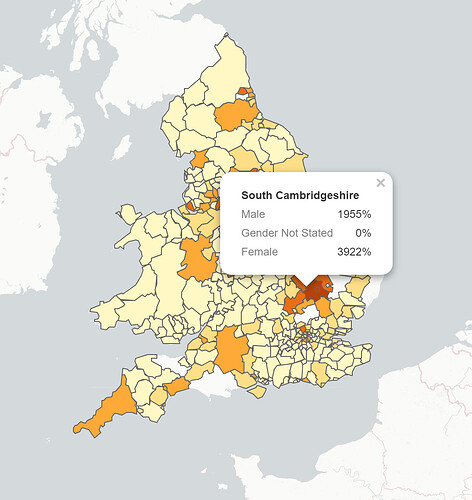
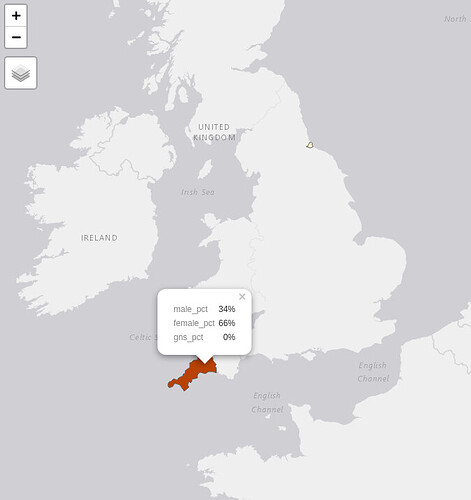
The variables in question are "Male" "Female" "Gender Not Stated"
# creating two line example data
data <- structure(list(lad19cd = c("E06000001", "E06000052"), objectid = c(1L,
49L), lad19nm = c("Hartlepool", "Cornwall"), bng_e = c(447160L,
212497L), bng_n = c(531474L, 64493L), long = c(-1.27018, -4.64254
), lat = c(54.67614, 50.450218), st_areasha = c(93712619.817559,
3548934061.31533), st_lengths = c(71011.9339493, 1241482.9365225
), `35 TO 39` = c(16L, 135L), white = c(181L, 848L), Male = c(104L,
492L), `RTB-IBD` = c(155L, 745L), `40 TO 44` = c(25L, 100L),
`45 TO 49` = c(19L, 128L), `Ethnicity Not Stated` = c(54L,
597L), `RTB-GLD` = c(41L, 570L), `16 TO 24` = c(12L, 131L
), `50 TO 54` = c(24L, 138L), `55 TO 59` = c(17L, 143L),
Female = c(132L, 962L), COMPARE = c(34L, 2L), `30 TO 34` = c(21L,
142L), `>=80` = c(10L, 24L), `65 TO 69` = c(22L, 115L), `60 TO 64` = c(28L,
115L), `not stated` = c(1L, 5L), INTERVAL = c(1L, 56L), `70 TO 74` = c(18L,
88L), `RTB-STR` = c(4L, 16L), `25 TO 29` = c(14L, 124L),
`Gender Not Stated` = 2:3, `75 TO 79` = c(12L, 70L), `RTB-INC` = 1:2,
RDC = c(2L, 8L), mixed = c(2L, 4L), `RTB-GEN` = c(NA, 58L
), asian = c(NA, 3L), `<=15` = c(NA, 4L), geometry = structure(list(
structure(list(list(structure(c(448986.02, 447072.101,
443444.7028, 442588.2966, 440052.7012, 448476.6765, 450118.9667,
450132.9512, 454039.03, 451736.05, 452570.529, 448986.02,
536729.68, 537135.9959, 533133.0017, 528536.0976, 527819.7026,
525831.9601, 525889.424, 525915.536, 528341.61, 532034.85,
533906.857, 536729.68), .Dim = c(12L, 2L)))), class = c("XY",
"MULTIPOLYGON", "sfg")), structure(list(list(structure(c(234998.8202,
234199.2005, 231675.7996, 226969.1972, 228841.9968, 226421.5025,
221174.0748, 219693.78, 220379.35, 219444.56, 214460.5,
212656.93, 209007, 205248, 204039, 202073.6, 192911.3,
189055.445, 185723.3, 184224.4, 175678.578, 175640.08,
172566.344, 169790.439, 168442.779, 163047.156, 158149.197,
154807.334, 150551.418, 147582.929, 143206.63, 140842.76,
137285.3, 135221.85, 135876.9, 134157.3994, 136594.2,
145706.03, 148210.311, 152517.724, 153594.542, 161765.89,
165363.8, 166815.81, 165929.6035, 169446.09, 171313.46,
173195.3, 177869.8, 181183.8524, 178400.24, 179260.2,
181955.21, 185101.85, 187807.85, 189018.71, 193211.19,
195934.7, 201605.8, 201741.19, 203898.05, 207591.75,
212215.7, 216120.09, 219355.15, 225603.6, 226774.45,
235955.42, 243532.247, 242824.77, 243911.78, 243028.6,
241872.3, 241450.8, 242606.17, 242283.75, 242585.29,
243305.19, 243570.27, 243752.23, 243628.5275, 236483.503,
236862.2976, 234998.8202, 85587.6273, 90329.4028, 98084.0031,
101116.0951, 110157.1971, 117556.2992, 117412.7424, 114860.61,
106454.29, 101066.96, 97814.5, 94004.29, 90871.3, 89188,
83911.2, 81276.2, 80080.1, 75965.452, 75629.3, 65319.3,
59125.553, 54647.032, 51879.281, 51475.164, 47480.287,
43544.349, 41887.089, 38259.782, 41399.896, 40983.218,
38502.49, 36067.55, 35259.5, 31695.19, 26719, 25091.146,
21508.7, 23826.2, 31062.812, 30547.462, 29159.056, 26447.31,
22515.3, 18843.11, 16533.7005, 11553.24, 11722.33, 16326.86,
16176.5, 21532.0955, 25186.62, 29758.8, 33564.69, 30937.38,
33634.05, 37739.51, 38942.78, 41252.69, 40955.9, 46485.13,
51499.1, 52498.96, 50935.2, 51230, 50188.29, 52316.6,
54063.23, 53817.89, 50574.037, 57101.11, 61854.2, 64425.91,
64075.22, 65591.63, 66286.69, 67931.3, 68882.1, 68711.36,
68553.3, 68240.53, 70929.8645, 78673.7992, 82399.9026,
85587.6273), .Dim = c(84L, 2L)))), class = c("XY", "MULTIPOLYGON",
"sfg"))), class = c("sfc_MULTIPOLYGON", "sfc"), precision = 0, bbox = structure(c(xmin = 134157.3994,
ymin = 11553.24, xmax = 454039.03, ymax = 537135.9959), class = "bbox"), crs = structure(list(
input = "OSGB 1936 / British National Grid", wkt = "PROJCRS[\"OSGB 1936 / British National Grid\",\n BASEGEOGCRS[\"OSGB 1936\",\n DATUM[\"OSGB 1936\",\n ELLIPSOID[\"Airy 1830\",6377563.396,299.3249646,\n LENGTHUNIT[\"metre\",1]]],\n PRIMEM[\"Greenwich\",0,\n ANGLEUNIT[\"degree\",0.0174532925199433]],\n ID[\"EPSG\",4277]],\n CONVERSION[\"British National Grid\",\n METHOD[\"Transverse Mercator\",\n ID[\"EPSG\",9807]],\n PARAMETER[\"Latitude of natural origin\",49,\n ANGLEUNIT[\"degree\",0.0174532925199433],\n ID[\"EPSG\",8801]],\n PARAMETER[\"Longitude of natural origin\",-2,\n ANGLEUNIT[\"degree\",0.0174532925199433],\n ID[\"EPSG\",8802]],\n PARAMETER[\"Scale factor at natural origin\",0.9996012717,\n SCALEUNIT[\"unity\",1],\n ID[\"EPSG\",8805]],\n PARAMETER[\"False easting\",400000,\n LENGTHUNIT[\"metre\",1],\n ID[\"EPSG\",8806]],\n PARAMETER[\"False northing\",-100000,\n LENGTHUNIT[\"metre\",1],\n ID[\"EPSG\",8807]]],\n CS[Cartesian,2],\n AXIS[\"(E)\",east,\n ORDER[1],\n LENGTHUNIT[\"metre\",1]],\n AXIS[\"(N)\",north,\n ORDER[2],\n LENGTHUNIT[\"metre\",1]],\n USAGE[\n SCOPE[\"Engineering survey, topographic mapping.\"],\n AREA[\"United Kingdom (UK) - offshore to boundary of UKCS within 49°45'N to 61°N and 9°W to 2°E; onshore Great Britain (England, Wales and Scotland). Isle of Man onshore.\"],\n BBOX[49.75,-9,61.01,2.01]],\n ID[\"EPSG\",27700]]"), class = "crs"), n_empty = 0L)), row.names = 1:2, class = "data.frame")
# making n/a into zeros
data[is.na(data)] <- 0
# converting from dataframe to sf so it can be used on tmap
final <- sf::st_sf(data,sf_column_name = 'geometry')
View(final)


