Creating GT Tables in R Woes

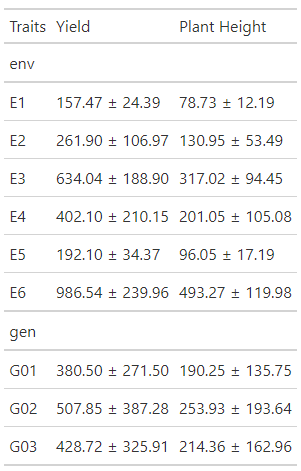
Good Morning Dear all, Please I am working on creating multiple tables for my thesis and I want to use the gt package so that. Below I attached a fake dataset and a screenshot of expected output. I will be very grateful if someone can help me out. Thanks

# Load Packages
library(gt)
library(tidyverse)
 # Fake dataset
Growth <-
  structure(
    list(
      env = structure(
        c(
          1L,
          1L,
          1L,
          1L,
          1L,
          1L,
          1L,
          1L,
          1L,
          1L,
          1L,
          1L,
          2L,
          2L,
          2L,
          2L,
          2L,
          2L,
          2L,
          2L,
          2L,
          2L,
          2L,
          2L,
          3L,
          3L,
          3L,
          3L,
          3L,
          3L,
          3L,
          3L,
          3L,
          3L,
          3L,
          3L,
          4L,
          4L,
          4L,
          4L,
          4L,
          4L,
          4L,
          4L,
          4L,
          4L,
          4L,
          4L,
          5L,
          5L,
          5L,
          5L,
          5L,
          5L,
          5L,
          5L,
          5L,
          5L,
          5L,
          5L,
          6L,
          6L,
          6L,
          6L,
          6L,
          6L,
          6L,
          6L,
          6L,
          6L,
          6L,
          6L
        ),
        levels = c("E1", "E2", "E3", "E4", "E5", "E6"),
        class = "factor"
      ),
      rep = structure(
        c(
          1L,
          1L,
          1L,
          2L,
          2L,
          2L,
          3L,
          3L,
          3L,
          4L,
          4L,
          4L,
          1L,
          1L,
          1L,
          2L,
          2L,
          2L,
          3L,
          3L,
          3L,
          4L,
          4L,
          4L,
          1L,
          1L,
          1L,
          2L,
          2L,
          2L,
          3L,
          3L,
          3L,
          4L,
          4L,
          4L,
          1L,
          1L,
          1L,
          2L,
          2L,
          2L,
          3L,
          3L,
          3L,
          4L,
          4L,
          4L,
          1L,
          1L,
          1L,
          2L,
          2L,
          2L,
          3L,
          3L,
          3L,
          4L,
          4L,
          4L,
          1L,
          1L,
          1L,
          2L,
          2L,
          2L,
          3L,
          3L,
          3L,
          4L,
          4L,
          4L
        ),
        levels = c("R1", "R2", "R3", "R4"),
        class = "factor"
      ),
      gen = structure(
        c(
          1L,
          2L,
          3L,
          1L,
          2L,
          3L,
          1L,
          2L,
          3L,
          1L,
          2L,
          3L,
          1L,
          2L,
          3L,
          1L,
          2L,
          3L,
          1L,
          2L,
          3L,
          1L,
          2L,
          3L,
          1L,
          2L,
          3L,
          1L,
          2L,
          3L,
          1L,
          2L,
          3L,
          1L,
          2L,
          3L,
          1L,
          2L,
          3L,
          1L,
          2L,
          3L,
          1L,
          2L,
          3L,
          1L,
          2L,
          3L,
          1L,
          2L,
          3L,
          1L,
          2L,
          3L,
          1L,
          2L,
          3L,
          1L,
          2L,
          3L,
          1L,
          2L,
          3L,
          1L,
          2L,
          3L,
          1L,
          2L,
          3L,
          1L,
          2L,
          3L
        ),
        levels = c(
          "G01",
          "G02",
          "G03",
          "G04",
          "G05",
          "G06",
          "G07",
          "G08",
          "G09",
          "G10",
          "G11",
          "G12",
          "G13",
          "G14",
          "G15",
          "G16",
          "G17",
          "G18"
        ),
        class = "factor"
      ),
      yield = c(
        139.82,
        182.52,
        171.71,
        141.26,
        182.52,
        160.97,
        126.72,
        182.52,
        138.15,
        114.52,
        182.52,
        166.4,
        401.71,
        296.22,
        180.31,
        210.38,
        375.53,
        51.14,
        166.95,
        337.11,
        385.3,
        192.17,
        314.83,
        231.17,
        449.4,
        457.84,
        545.45,
        440.62,
        515.34,
        962.56,
        663.81,
        625.93,
        932.53,
        773.59,
        462.25,
        779.18,
        458.43,
        862.26,
        400.05,
        192.78,
        591.57,
        242.55,
        338.52,
        604.8,
        204.12,
        186.69,
        500.43,
        242.97,
        195.35,
        168.85,
        195.12,
        195.1,
        158.85,
        200,
        197.93,
        147.01,
        211.63,
        199.5,
        157.01,
        278.85,
        984.38,
        984.38,
        754.69,
        689.06,
        1220.62,
        885.69,
        836.72,
        1594.68,
        951.56,
        836.68,
        1082.81,
        1017.19
      ),
      `Plant Height` = c(
        69.91,
        91.26,
        85.855,
        70.63,
        91.26,
        80.485,
        63.36,
        91.26,
        69.075,
        57.26,
        91.26,
        83.2,
        200.855,
        148.11,
        90.155,
        105.19,
        187.765,
        25.57,
        83.475,
        168.555,
        192.65,
        96.085,
        157.415,
        115.585,
        224.7,
        228.92,
        272.725,
        220.31,
        257.67,
        481.28,
        331.905,
        312.965,
        466.265,
        386.795,
        231.125,
        389.59,
        229.215,
        431.13,
        200.025,
        96.39,
        295.785,
        121.275,
        169.26,
        302.4,
        102.06,
        93.345,
        250.215,
        121.485,
        97.675,
        84.425,
        97.56,
        97.55,
        79.425,
        100,
        98.965,
        73.505,
        105.815,
        99.75,
        78.505,
        139.425,
        492.19,
        492.19,
        377.345,
        344.53,
        610.31,
        442.845,
        418.36,
        797.34,
        475.78,
        418.34,
        541.405,
        508.595
      )
    ),
    class = "data.frame",
    row.names = c(NA,
                  -72L)
  )

# Sreenshot of Expected Output

Thank you very much!!!

Is this the sort of thing you're after? I can't quite tell what summary statistics you're using in your output so I just guessed mean +/- SD

summarise_growth <- function(by) {
  tibble(Growth) |>
    summarise(
      yield_avg = mean(yield),
      yield_sd  = sd(yield),
      plant_avg = mean(`Plant Height`),
      plant_sd  = sd(`Plant Height`),
      .by = all_of(by)
    ) |> 
    mutate(across(where(is.numeric), ~format(round(.x, 2), nsmall = 2)))
}

bind_rows(summarise_growth("env"),
          summarise_growth("gen")) |>
  pivot_longer(c(env, gen), names_to = "group", values_to = "Traits") |>
  drop_na(Traits) |> 
  relocate(Traits) |> 
  mutate(
    Yield = glue::glue("{yield_avg} ± {yield_sd}"),
    `Plant Height` = glue::glue("{plant_avg} ± {plant_sd}"),
    .keep = "unused"
  ) |> 
  gt::gt(groupname_col = "group") |> 
  gt::cols_align("left")

image

1 Like

Thank you very much @JackDavison; Please I want to ask what about if I perform a post hoc test for each group of treatment e.g., Genotype and Environment, how can I add that letter as a superscript to the tables. Thank you very much I am very grateful!!!

No worries!

You can add subscripts and superscripts using md() / fmt_markdown():

data.frame(
  sub = c("NO<sub>x</sub>", "PM<sub>2.5</sub>", "SO<sub>2</sub>")
) |> 
  gt::gt() |> 
  gt::fmt_markdown(columns = "sub") |> 
  gt::cols_label(sub ~ gt::md("<sub>sub</sub> normal <sup>sup</sup>"))

image

1 Like

Thanks you very much for the help.

What I was saying is that if I fit bunch of models in R e.g.

mod <- lm(Yield~Rep+Gen*Env,data=Growth)
anova(mod)

agricolae::HSD.test(y=mod,trt='Gen',console=TRUE)
agricolae::HSD.test(y=mod,trt='Env',console=TRUE)

How can I extract the group column from here and add it to that table as a superscript. Sorry for not being clear in my initial post.

@JackDavison this code below will work for me, but I have to be doing this for each trait and then I will now merge all the data together to form a tibble and then follow your approach to create all the tables. I don't know if there is a better way to do this. Thank you very much for the help today.

#install.packages('agricolae')
library(tidyverse)
library(agricolae)
library(gt)

mod1 <- lm(yield~rep+gen+env,data=Growth)
test <- HSD.test(y = mod,trt = 'env',console = TRUE)
test$groups %>% 
  as_tibble() %>% 
  rename(Yield=`Growth[[i]]`) %>% 
  mutate(Yield=round(Yield,2)) %>% 
  mutate(Yield = glue::glue("{Yield}{groups}")) %>% 
  select(-groups) %>% 
  gt()

Good Morning @JackDavison as a follow up to our conversation yesterday, please find attached below the screenshot of what my supervisor said I should work on. here I used the agricolae package for the post hoc test. The post hoc test letters should be in superscript.

# Sample code:
# Fit model for yield

mod1 <- lm(yield~rep+gen+env,data=Growth)

# Fit the second model for Plant Height

mod2 <- lm(`Plant Height`~rep+gen+env,data=Growth)

# Post hoc-test for environment and Genotype first model

test1 <- HSD.test(y = mod1,trt = 'env',console = TRUE)

test2 <- HSD.test(y = mod1,trt = 'gen',console = TRUE)


## Second Traits Plant Height
test3 <- HSD.test(y = mod2,trt = 'env',console = TRUE)

test4 <- HSD.test(y = mod2,trt = 'gen',console = TRUE)

## Post Hoc Groups

test1_env <- test1$groups %>% 
  rename(Yield=yield) %>% 
  mutate(Yield=round(Yield,2)) %>% 
  mutate(Yield = glue::glue("{Yield}{groups}")) %>% 
  select(-groups) 


test1_gen <- test2$groups %>% 
  rename(Yield=yield) %>% 
  mutate(Yield=round(Yield,2)) %>% 
  mutate(Yield = glue::glue("{Yield}{groups}")) %>% 
  select(-groups) 


# Plant Height ------------------------------------------------------------

test2_env <- test3$groups %>% 
  rename(Plant_Height=`Plant Height`) %>% 
  mutate(Plant_Height=round(Plant_Height,2)) %>% 
  mutate(Plant_Height = glue::glue("{Plant_Height}{groups}")) %>% 
  select(-groups) 


test2_gen <- test4$groups %>% 
  rename(Plant_Height=`Plant Height`) %>% 
  mutate(Plant_Height=round(Plant_Height,2)) %>% 
  mutate(Plant_Height = glue::glue("{Plant_Height}{groups}")) %>% 
  select(-groups) 


# Data Wrangling

bind_rows(test1_env,test1_gen,test2_env,test2_gen) %>% 
  gt(rownames_to_stub = TRUE)

Thank you very much for the help.

I tried this other approach, but now I don't know the better way to add the group labels from the post hoc test on the table:

library(gt)
library(tidyverse)

Growth %>%
    pivot_longer(cols = c(gen, env), values_to = "Traits") %>%
    mutate(name = if_else(name == "gen", "Genotype", "Env") %>% as_factor()) %>%
    group_by(name, Traits) %>%
    summarise(`Plant Height` = mean(`Plant Height`),
              Yield = mean(yield)) %>%
    gt() %>%
    tab_options(
        table_body.hlines.color = "#FFFFFF",
        row_group.font.weight = "bold"
        )

It might be helpful for you to know how to properly format code and console output that you post here. Using proper code formatting makes the site easier to read, prevents confusion (unformatted code can get garbled by the forum software :anguished:), and is generally considered the polite thing to do. Check out this FAQ to find out how — it's as easy as the click of a button! :grinning::

1 Like

Thank you very much @nirgrahamuk @JackDavison this my approach which I used to arrive at the final output, but I know there will be a more efficient way:

Packages

library(gt)
library(tidyverse)
library(agricolae)# Fit model for yield

# Fit the second model for Plant Height

mod1 <- lm(yield~rep+gen+env,data=Growth)

mod2 <- lm(`Plant Height`~rep+gen+env,data=Growth)

# Post hoc-test for environment and Genotype first model

test1 <- HSD.test(y = mod1,trt = 'env',console = TRUE)

test2 <- HSD.test(y = mod1,trt = 'gen',console = TRUE)

# Second Traits

test3 <- HSD.test(y = mod2,trt = 'env',console = TRUE)

test4 <- HSD.test(y = mod2,trt = 'gen',console = TRUE)


test1_env <- test1$groups %>% 
  rename(Yield=yield) %>% 
  mutate(Yield=round(Yield,2)) %>% 
  mutate(Yield = glue::glue("{Yield}{groups}")) %>% 
  select(-groups) %>% 
  rownames_to_column(var = 'env')

test1_env


test1_gen <- test2$groups %>% 
  rename(Yield=yield) %>% 
  mutate(Yield=round(Yield,2)) %>% 
  mutate(Yield = glue::glue("{Yield}{groups}")) %>% 
  select(-groups) %>% 
  rownames_to_column(var = 'gen')

test1_gen

## Second Traits Plant Height

test3_env <- test3$groups %>% 
  rename(Plant_Height=`Plant Height`) %>% 
  mutate(Plant_Height=round(Plant_Height,2)) %>% 
  mutate(Plant_Height = glue::glue("{Plant_Height}{groups}")) %>% 
  select(-groups) %>% 
  rownames_to_column(var = 'env')

test3_env

test4_gen <- test4$groups %>% 
  rename(Plant_Height=`Plant Height`) %>% 
  mutate(Plant_Height=round(Plant_Height,2)) %>% 
  mutate(Plant_Height = glue::glue("{Plant_Height}{groups}")) %>% 
  select(-groups) %>% 
  rownames_to_column(var = 'gen')


test4_gen

# Table 1 (Yield)

gt1 <- bind_rows(test1_gen,test1_env) %>% 
  #as_tibble() %>% 
  pivot_longer(cols = c(env,gen),names_to = 'Trait',values_to = 'env') %>%
  #pivot_longer(cols = -c(3:4),names_repair = 'minimal')
  drop_na(env) %>% 
  #rename(Traits=value) %>% 
  relocate(env,Trait) %>% 
  rename(Traits=env) %>% 
  gt(groupname_col = 'Trait') 

# Print the tables
  
gt1  

gt2 <- bind_rows(test3_env,test4_gen) %>% 
  #as_tibble() %>% 
  pivot_longer(cols = c(env,gen),names_to = 'Trait',values_to = 'env') %>%
  #pivot_longer(cols = -c(3:4),names_repair = 'minimal')
  drop_na(env) %>% 
  #rename(Traits=value) %>% 
  relocate(env,Trait) %>% 
  rename(Traits=env) %>% 
  #group_by() %>% 
  gt(groupname_col = 'Trait') 


# Print the table

gt2 

## Extract the data out from the GT Object

d1 <- gt1$`_data`

d2 <- gt2$`_data`


bind_rows(d1,d2) %>% 
  pivot_longer(cols = c(3:4)) %>% 
  drop_na(value) %>% 
  pivot_wider(names_from = name,values_from = value) %>% 
  gt(groupname_col = 'Trait') %>% 
  tab_options(
    table_body.hlines.color = "#FFFFFF",
    row_group.font.weight = "bold"
  )

This topic was automatically closed 21 days after the last reply. New replies are no longer allowed.

If you have a query related to it or one of the replies, start a new topic and refer back with a link.