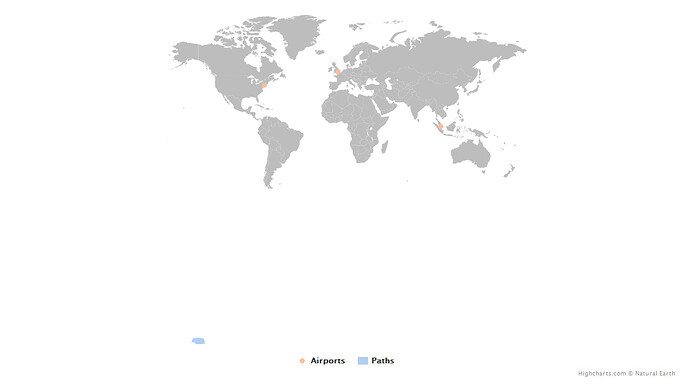
I'm using the highcharter package to generate world maps with flight paths using a simple example: plot three airports and draw flight paths between them. There airports are Heathrow, JFK, and Singapore. The routes are Heathrow to JFK, Heathrow to Singapore, and JFK to Singapore.
The arcs for each route is generated using the gcIntermediate(...) function from the geosphere package. All arcs are combined into a single object, and then converted to jsn format (geojsonio::as.json(..)).
The problem occurs when the maplines are added to the map. They appear quite small (see screenshot). My guess is that the function hc_add_series is interpreting the flight path data (lat, lon) as SVG x and y coordinates. This would explain why the flight paths are clusted in the lower left corner.
The demo on the highcharts page (https://www.highcharts.com/maps/demo/flight-routes) uses the function pointsToPath to convert lat/lon values to SVG. After a crash course in geoJSON, specifying naming the Coordinate Reference System could work, but I'm not sure if I'm applying the properties correctly.
I attempted to convert the geoJSON object into a Simple Features object using geojson_sf(...) from the sf package, but the map failed to load.
My questions are:
- Should the lat/lon values be converted outside of the highmaps (from lat/lon to svg) or am I missing the "correct" CRS properties?
- Is there a simpler way to transform the data from data.frame to geoJSON?
Screenshot
Example
# install pkgs
# install.packages("highcharter")
# install.packages("geosphere")
# install.packages("geojsonio")
# install.packages("sf")

# load pkgs
library(tidyverse)
library(highcharter)
library(geosphere)
library(geojsonio)


# build sample data
df <- data.frame(
  id = c("New York", "London", "Singapore"),
  code = c("JFK","LHR","SIN"),
  lon = c(-73.9675438,-0.2416795,103.9915308),
  lat = c(40.7828647,51.5285582,1.3644202),
  stringsAsFactors = FALSE
)

# generate arcs for each route
# for demonstration, set n = 10

# LHR --> JFK
arcs_lhr_jkf <- geosphere::gcIntermediate(
  p1 = c(df$lon[2], df$lat[2]),
  p2 = c(df$lon[1], df$lat[1]),
  n = 10
) %>%
  as.data.frame() %>%
  mutate(id = "lhr_jfk")

# LHR --> SIN
arcs_lhr_sin <- geosphere::gcIntermediate(
  p1 = c(df$lon[2], df$lat[2]),
  p2 = c(df$lon[3], df$lat[3]),
  n = 10
)  %>%
  as.data.frame() %>%
  mutate(id = "lhr_sin")

# JFK --> SIN
arcs_jfk_sin <- geosphere::gcIntermediate(
  p1 = c(df$lon[1], df$lat[1]),
  p2 = c(df$lon[3], df$lat[3]),
  n = 10
)  %>%
  as.data.frame() %>%
  mutate(id = "jfk_sin")


# combine routes into single object
arcs <- rbind(arcs_lhr_jkf, arcs_lhr_sin, arcs_jfk_sin)

# view plot to check
plot(arcs$lon, arcs$lat)

# restructure into multilinestring jsn format (for now, build manually)
jsn <- list(
  type = "FeatureCollection",
  totalFeatures = length(unique(arcs$id)),
  features = list(

    # route 1: lhr --> jfk
    list(
      type = "Feature",
      id = unique(arcs$id)[1],
      geometry = list(
        type = "MultiLineString",
        coordinates = list(
          list(
            c(arcs$lon[1],arcs$lat[1]),
            c(arcs$lon[2],arcs$lat[2]),
            c(arcs$lon[3],arcs$lat[3]),
            c(arcs$lon[4],arcs$lat[4]),
            c(arcs$lon[5],arcs$lat[5]),
            c(arcs$lon[6],arcs$lat[6]),
            c(arcs$lon[7],arcs$lat[7]),
            c(arcs$lon[8],arcs$lat[8]),
            c(arcs$lon[9],arcs$lat[9]),
            c(arcs$lon[10],arcs$lat[10])
          )
        )
      ),
      properties = list(
        "flight" = "lhr_jfk",
        "time_est" = "7hrs"
      )
    ),

    # route 2: lhr --> sin
    list(
      type = "Feature",
      id = unique(arcs$id)[2],
      geometry = list(
        type = "MultiLineString",
        coordinates = list(
          list(
            c(arcs$lon[11],arcs$lat[11]),
            c(arcs$lon[12],arcs$lat[12]),
            c(arcs$lon[13],arcs$lat[13]),
            c(arcs$lon[14],arcs$lat[14]),
            c(arcs$lon[15],arcs$lat[15]),
            c(arcs$lon[16],arcs$lat[16]),
            c(arcs$lon[17],arcs$lat[17]),
            c(arcs$lon[18],arcs$lat[18]),
            c(arcs$lon[19],arcs$lat[19]),
            c(arcs$lon[20],arcs$lat[20])
          )
        )
      ),
      properties = list(
        "flight" = "lhr_sin",
        "time" = "14hrs"
      )
    ),

    # route 3: jfk --> sin
    list(
      type = "Feature",
      id = unique(arcs$id)[3],
      geometry = list(
        type = "MultiLineString",
        coordinates = list(
          list(
            c(arcs$lon[21],arcs$lat[21]),
            c(arcs$lon[22],arcs$lat[22]),
            c(arcs$lon[23],arcs$lat[23]),
            c(arcs$lon[24],arcs$lat[24]),
            c(arcs$lon[25],arcs$lat[25]),
            c(arcs$lon[26],arcs$lat[26]),
            c(arcs$lon[27],arcs$lat[27]),
            c(arcs$lon[28],arcs$lat[28]),
            c(arcs$lon[29],arcs$lat[29]),
            c(arcs$lon[30],arcs$lat[30])
          )
        )
      ),
      properties = list(
        "flight" = "jfk_sin",
        "time" = "24hrs"
      )
    )
  ),
  crs = list(
    type = "name",
    properties = list(
      "name" = "urn:ogc:def:crs:OGC:1.3:CRS84"
    )
  )
)


# as.json
geoJSN <- geojsonio::as.json(x= jsn)

# does sf work?
# library(sf)
# g <- geojson_sf(geoJSN)

#'////////////////////////////////////////

# start with defining the base map
base <- hcmap(showInLegend = FALSE,
              nullColor = "#bdbdbd",
              borderWidth = 0)


# build map
base %>%
  hc_add_series(data = df,
                type = "mappoint",
                name = "Airports",
                color = "#FFBFA0",
                showInLegend = TRUE) %>%
  hc_add_series(data = geoJSN,
                type = "mapline",
                name = "Paths",
                geojson = TRUE,
                lineWidth = 12,
                color = "#B2CFF2",
                showInLegend = TRUE) %>%
  hc_tooltip(enabled = TRUE)
