I have a vector say x <- c('a','b','c')
now I want to create an empty dataframe with column names as those in x. Values in x can be any character value, doesn't need to be a,b,c necessarily.
1 Like
Hi,
Here is one way:
x = c("A", "B", "C")

myData = as.data.frame(matrix(numeric(),nrow = 0, ncol = length(x)))
colnames(myData) = x

myData
[1] A B C
<0 rows> (or 0-length row.names)
Question: why do you want to do this?
Hope this helps,
PJ
to add to PJ's solution:
you can also declare the colnames while constructing the matrix.
x <- c('a','b','c')

df <- as.data.frame(
  matrix(ncol = length(x), nrow=0,
             dimnames = list(NULL,x))
)
the dimnames argument must be a list of 2 vectors, first the rownames, then the colnames
1 Like
I don't know why, but I got completely engrossed in code golfing this question. The most succinct I've been able to come up with are
x <- c("A", "B", "C")
df <- as.data.frame(sapply(x, function(x) numeric()))
df <- as.data.frame(vapply(x, function(x) numeric(), numeric()))
df <- as.data.frame(replicate(length(x), numeric()), col.names = x)
df <- as.data.frame(matrix(ncol = length(x), nrow=0, dimnames = list(NULL,x)))
df <- as.data.frame(matrix(numeric(),nrow = 0, ncol = length(x))); names(df) <- x
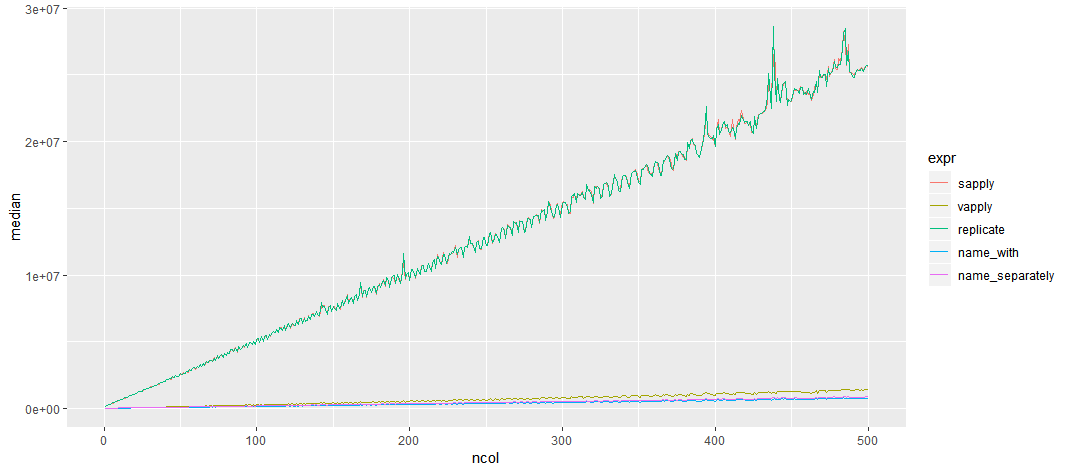
But succinct doesn't translate into efficient. I timed this over data frames from 1 to 500 columns (why anyone would ever make 500 columns of a data frame like this, I don't know, but let's not have reality interfere with ridiculous fun)
The best performer ends up being
df <- as.data.frame(matrix(ncol = length(x), nrow=0, dimnames = list(NULL,x)))`
in case you're really desperate to save yourself a few microseconds. (and I might need a better hobby)
library(dplyr)
library(tidyr)
library(ggplot2)

bench_fun <- function(x){
  x <- sprintf("X%s", seq_len(x))
  microbenchmark(
    sapply = df <- as.data.frame(sapply(x, function(x) numeric())),
    vapply = df <- as.data.frame(vapply(x, function(x) numeric(), numeric())),
    replicate = df <- as.data.frame(replicate(length(x), numeric()), col.names = x),
    name_with = df <- as.data.frame(matrix(ncol = length(x), nrow=0, dimnames = list(NULL,x))),
    name_separately = {df <- as.data.frame(matrix(numeric(),nrow = 0, ncol = length(x))); names(df) <- x}
  )
}

Bench <-
  data_frame(ncol = 1:500) %>%
  mutate(result = lapply(ncol, bench_fun))

X <- Bench %>%
  mutate(result = lapply(result, as.data.frame)) %>%
  unnest(result) %>%
  group_by(ncol, expr) %>%
  summarise(median = median(time, na.rm = TRUE)) %>%
  ungroup()

ggplot(data = X,
       mapping = aes(x = ncol,
                     y = median,
                     colour = expr)) +
  geom_line()
3 Likes
I just love your thoroughness and the fact you go all out on something like this ![]()
Sometimes coding is just fun for the sillyness of it... keep doing that! Although I must say I like the benchmarking you did. It's often overlooked how efficiency is an integral part of good coding practices.
PJ
You are crazy man. Anyway good effort, impressed ![]()
This topic was automatically closed 7 days after the last reply. New replies are no longer allowed.