It's preferable to provide a reprex. See the FAQ so that answers better can be tailored to the specific data.
community = c(
"Macoupin County", "Bond County",
"Christian County", "Grundy County", "Jefferson County", "Brown County",
"Coles County", "McDonough County", "Morgan County", "Clay County"
)
d <- data.frame(
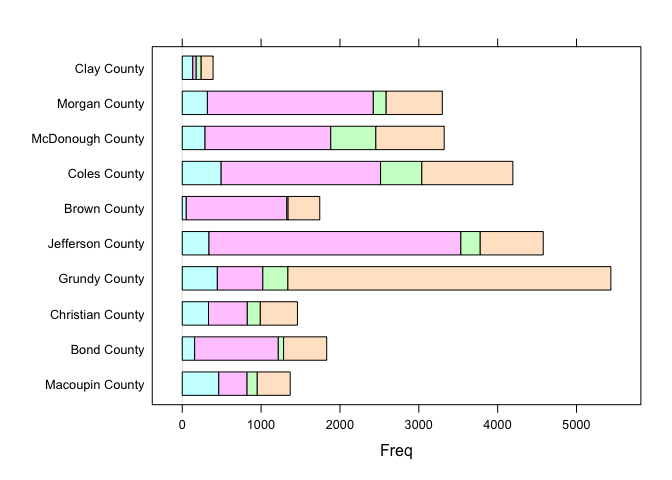
women = c(463, 157, 333, 445, 339, 51, 493, 289, 319, 134),
men = c(
359, 1061, 492, 577, 3194, 1275, 2022, 1594, 2104,
43
), girls = c(
129, 67, 165, 318, 246, 16, 523, 572, 163,
63
), boys = c(
418, 547, 471, 4096, 799, 402, 1155, 867, 712,
151
)
)
m <- as.matrix(d)
row.names(m) <- community
lattice::barchart(m)
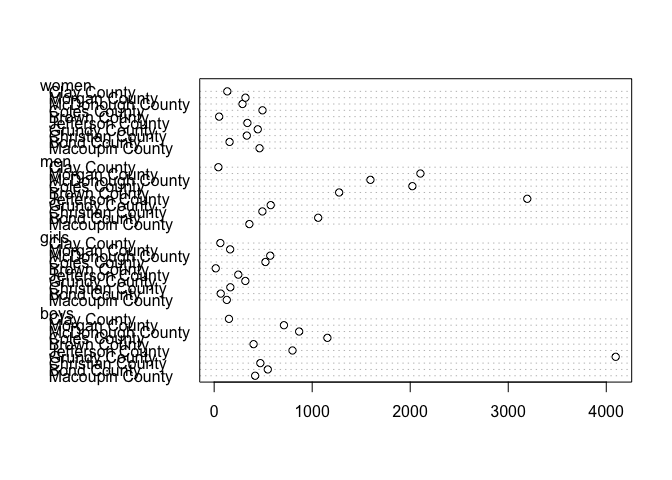
dotchart(m)
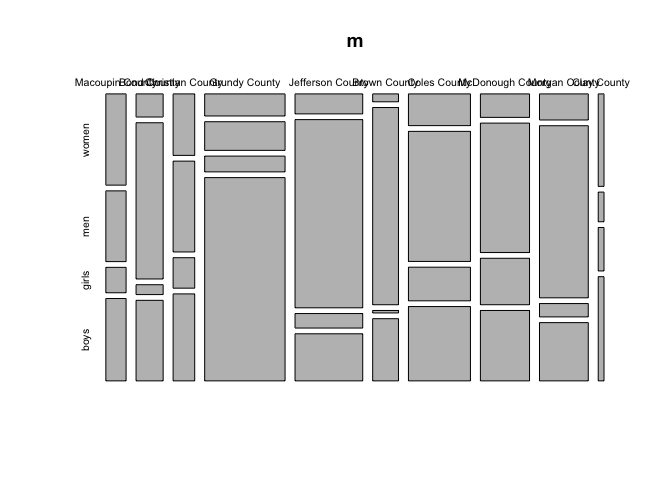
mosaicplot(m)
Created on 2023-03-18 with reprex v2.0.2