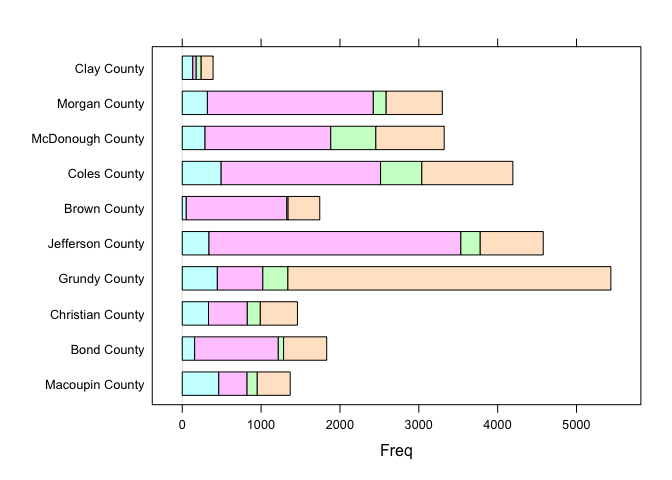
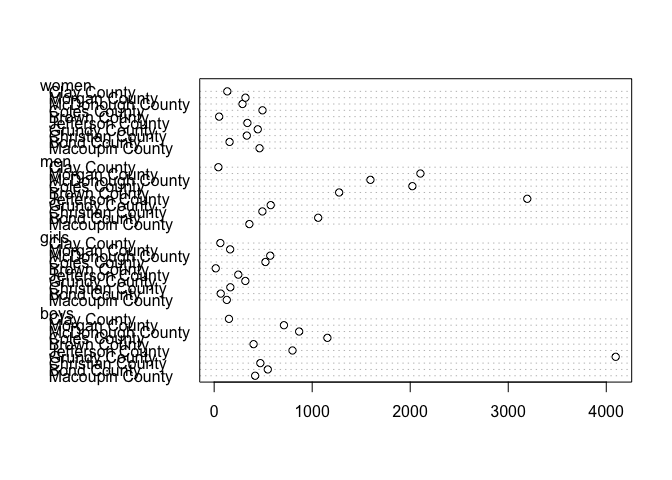
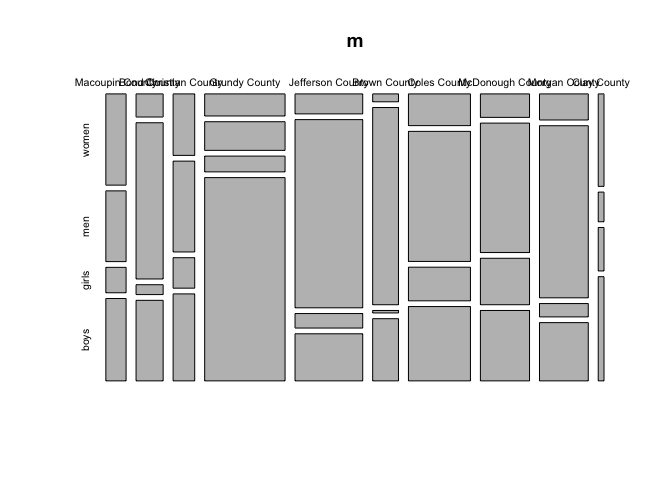
I have a table in CSV with first column "Community", second column with name "girls", second column with name "boys" , third column "men"...etc. under community column it contains names of different communities, under column of "girls" it contains number of girls for various communities(e.g: 100) also for other column. I want to create a bar chart for all communities with other column information.
Thank you