ebritt
January 30, 2020, 8:40pm
1
I am very new to R and I am trying to generate a heatmap in RStudio and received this error message. Does anyone know how I can fix this, thank you!
mine.heatmap <- ggplot(data = mine.long, mapping = aes(x = Sample.name,
                                                       y = Class,
                                                       fill = Abundance)) +
  geom_tile() +
  xlab(label = "Sample")

mine.heatmap '''

Error: You're passing a function as global data.
Have you misspelled the `data` argument in `ggplot()`
FJCC
January 30, 2020, 9:03pm
2
It seems mine.long is a function. Can you show what generates mine.long? What do you get if you run the command
str(mine.long)
ebritt
January 30, 2020, 9:22pm
3
'data.frame': 900 obs. of 3 variables: Sample.name: Factor w/ 18 levels "fmlp_30min_A",..: 10 11 12 13 14 15 4 5 6 16 ...
Metabolite : chr "X2.hydroxyglutarate" "X2.hydroxyglutarate" "X2.hydroxyglutarate" "X2.hydroxyglutarate" ...
FJCC
January 30, 2020, 9:31pm
4
That certainly makes the error message hard to understand. Though it seems like a different problem, I am surprised that I do not see a column named Class in the output of str(mine.long). Does that column exist?
ebritt
January 30, 2020, 10:01pm
5
No, the Class column does not exist. However when ran the code I changed "Class" to "Metabolite". I have three columns in mine.long Sample.name, Metabolite, and Abundance.
FJCC
January 30, 2020, 11:01pm
6
Another problem I see is that the Abundance column is of the type character. You can fix that
mine.long$Abundance <- as.numeric(mine.long$Abundance)
However, I do not expect that to fix the error message. Can you make a reproducible example from a subset of your data? It would be enough to have two categories of sample.name and two of Metabolite. Then post the data and the call to ggplot. Others can then work with exactly the data you are using. Information about how to make a reproducible example are in the following post:
A minimal reproducible example consists of the following items:
A minimal dataset, necessary to reproduce the issue
The minimal runnable code necessary to reproduce the issue, which can be run
on the given dataset, and including the necessary information on the used packages.
Let's quickly go over each one of these with examples:
ebritt
January 31, 2020, 9:23pm
7
Code adapted from: ` https://jcoliver.github.io/learn-r/006-heatmaps.html
mine.data <- read.csv(file = "data.csv" )
install.packages("tidyr")
library ( "tidyr" )
mine.long <- gather(data = mine.data, key = Metabolite, value = Abundance)
head(mine.long)
str(mine.data)
mine.long <- gather(data = mine.data, key = Class, value = Abundance, -c( 1 : 1 ))
head(mine.long)
install.packages( "ggplot2" )
library ( "ggplot2" )
mine.heatmap <- ggplot(data = mine.long, mapping = aes(x = Sample.name,
y = Metabolite,
fill = Abundance)) +
geom_tile() +
xlab(label = "Sample" )
mine.heatmap
plot.object.name <- ggplot(data, mapping) +
layer.one() +
layer.two() +
layer.three()
plot.object.name
Sample.name
2-hydroxyglutarate
3PG
acetyl-lysine
N0_A
-0.000536806
-0.074983518
-0.224292484
N0_B
-0.000833351
-0.031069135
-0.010536334
N0_C
-1.10E-05
-0.049364209
-0.040049633
PMA_30min_A
-0.570842671
0.864493538
-1.488582331
PMA_30min_B
-0.468878552
0.6895598
-2.726207287
PMA_30min_C
-0.843629046
0.703503689
-3.562324625
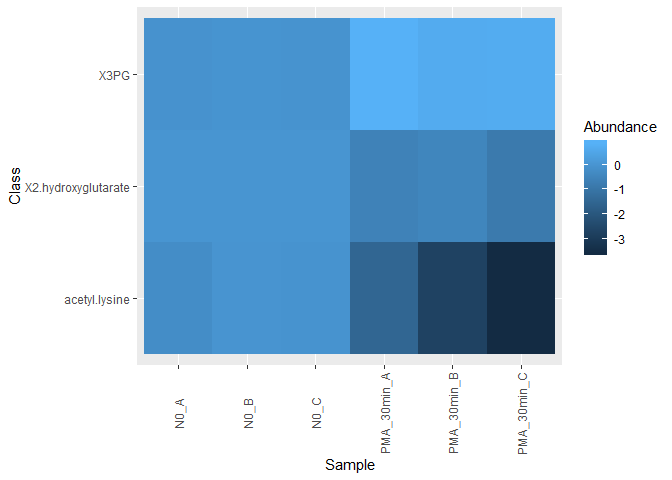
FJCC
February 1, 2020, 3:40am
8
Here is a heat map generated by running a slightly modifed subset of your code.
library(ggplot2)
library(tidyr)
mine.data <- read.csv(file = "c:/users/fjcc/Documents/R/Play/Dummy.csv")
mine.data
#>   Sample.name X2.hydroxyglutarate        X3PG acetyl.lysine
#> 1        N0_A        -0.000536806 -0.07498352   -0.22429248
#> 2        N0_B        -0.000833351 -0.03106914   -0.01053633
#> 3        N0_C        -0.000011000 -0.04936421   -0.04004963
#> 4 PMA_30min_A        -0.570842671  0.86449354   -1.48858233
#> 5 PMA_30min_B        -0.468878552  0.68955980   -2.72620729
#> 6 PMA_30min_C        -0.843629046  0.70350369   -3.56232463
mine.long <- gather(data = mine.data, key = Class, value = Abundance, -c( 1 : 1 ))
head(mine.long)
#>   Sample.name               Class    Abundance
#> 1        N0_A X2.hydroxyglutarate -0.000536806
#> 2        N0_B X2.hydroxyglutarate -0.000833351
#> 3        N0_C X2.hydroxyglutarate -0.000011000
#> 4 PMA_30min_A X2.hydroxyglutarate -0.570842671
#> 5 PMA_30min_B X2.hydroxyglutarate -0.468878552
#> 6 PMA_30min_C X2.hydroxyglutarate -0.843629046
mine.heatmap <- ggplot(data = mine.long,
                       mapping = aes(x = Sample.name, y = Class,fill = Abundance)) +
  geom_tile() + xlab(label = "Sample" ) +
  theme(axis.text.x = element_text(angle = 90, hjust = 0.5, vjust = 0.5))
mine.heatmap
Created on 2020-01-31 by the reprex package (v0.3.0)
system
February 22, 2020, 3:40am
9
This topic was automatically closed 21 days after the last reply. New replies are no longer allowed.